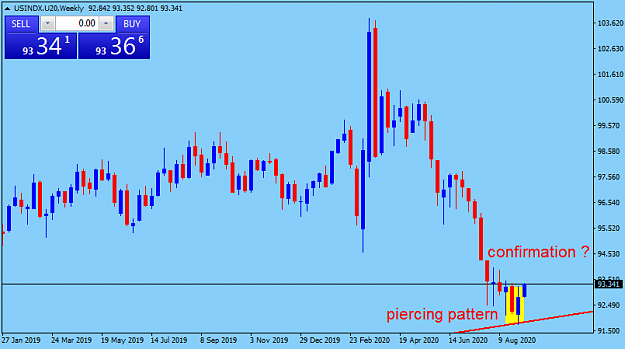
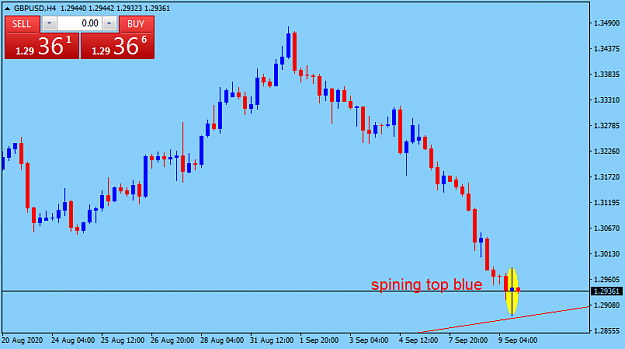
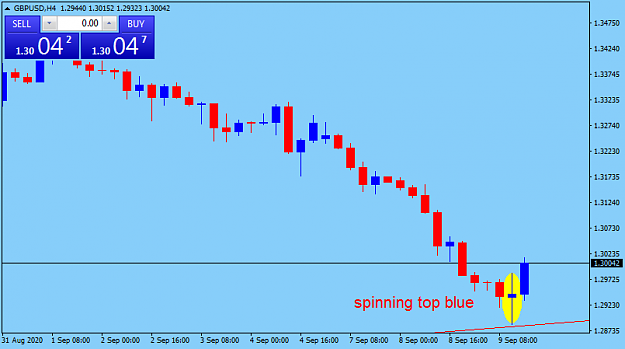
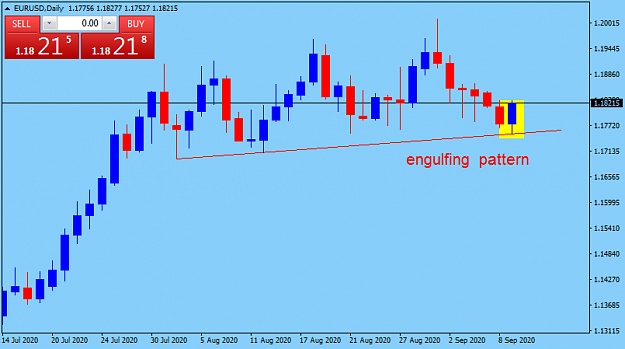
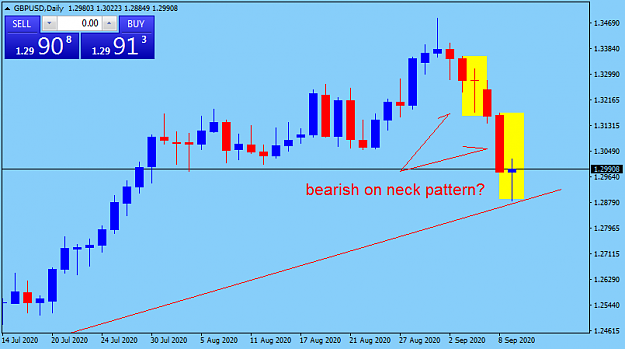
game of spinning top in this zone also Kiss the lower wick with TL , What does it mean for us ?
Confusion of sellers or Indifference of buyers for a pullback
game of spinning top in this zone also Kiss the lower wick with TL , What does it mean for us ? Confusion of sellers or Indifference of buyers for a pullback {image}
Joined Nov 2007
|
Status: left CanaryWharf desk-tea break
|23,550 Posts
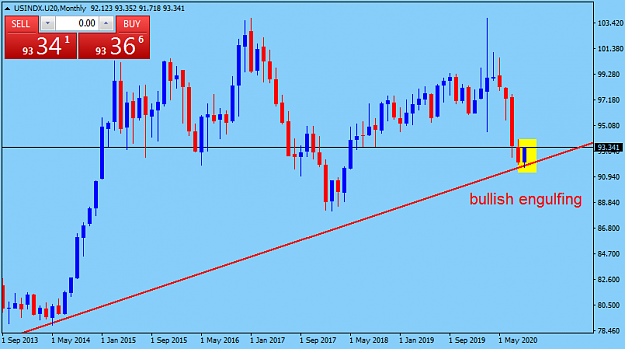
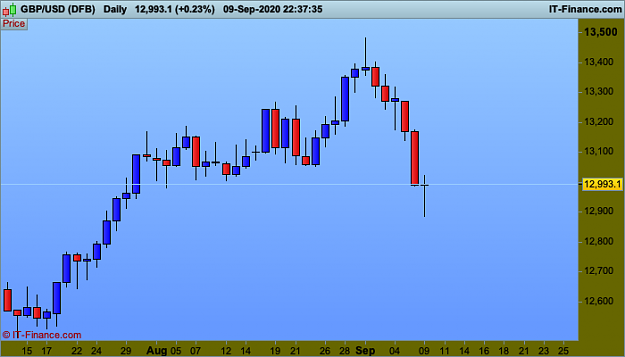
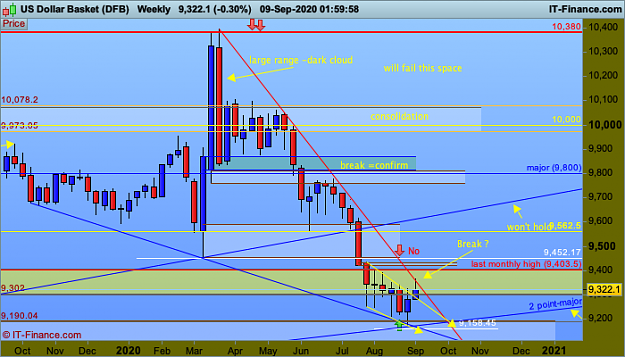
$ basket has reacted to a super tl ,the first thing is for it to hold on to the weekly open.
But its main job is to break free, could be it has to open through it next ,so close Friday at the line at least.To confirm the last.