Hey Team,
I hope you are having a great weekend.
I have got a brand-new strategy that I am seeing great results so far. The system is averaging around 10 pips a day and would like to share the strategy with the community.
VIDEO 1 - STRATEGY / TIME FRAME / ENTRY SETUP & RISK MANAGEMENT (Released 2nd August 2020)
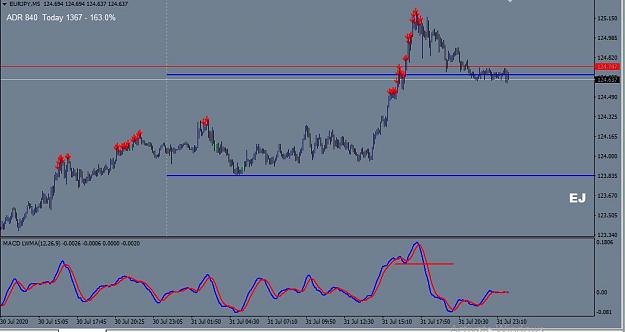
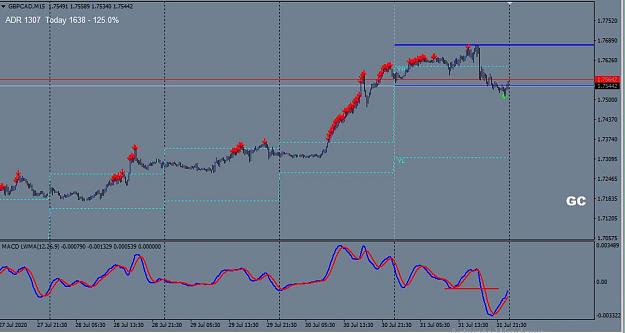
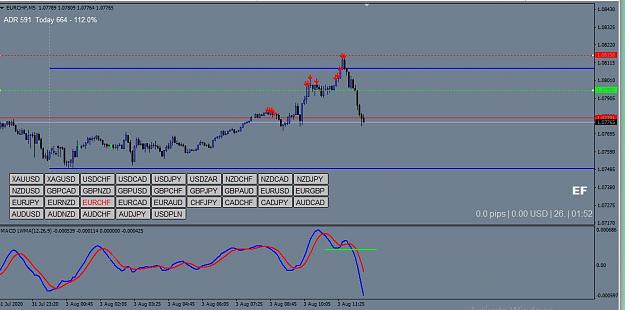
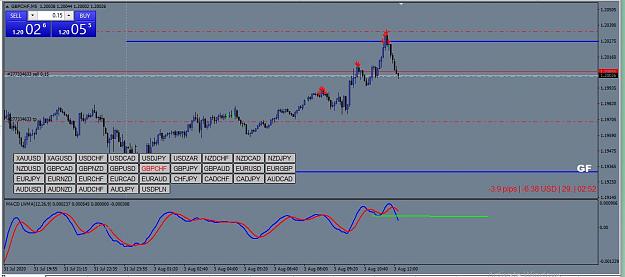
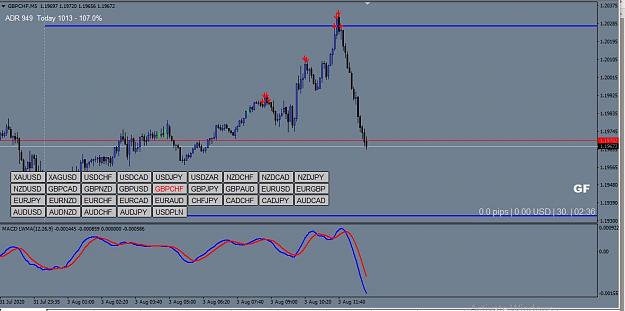
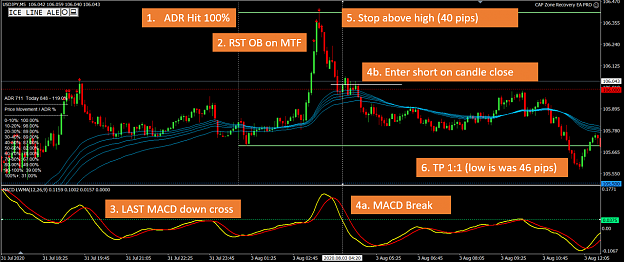
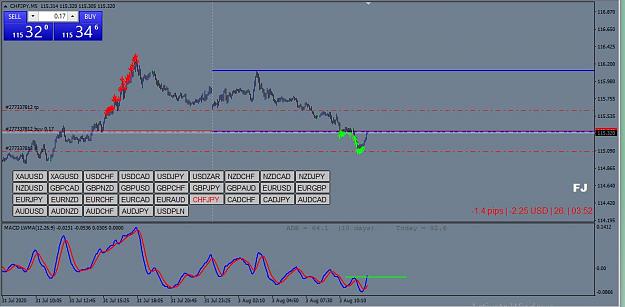
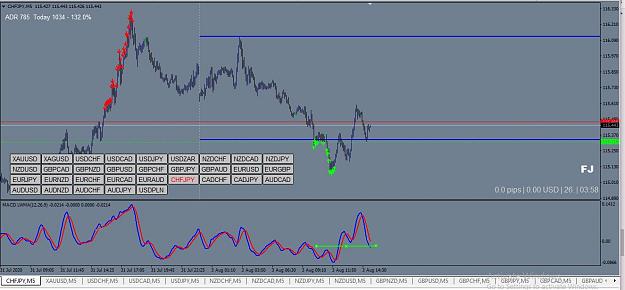
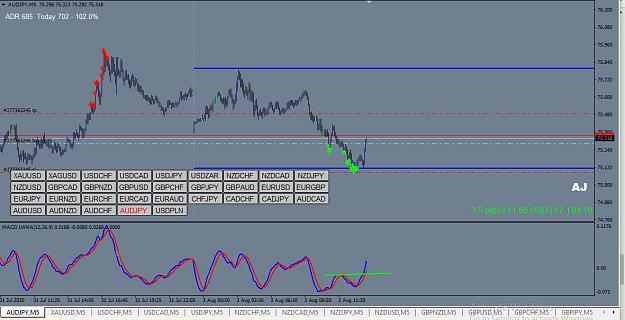
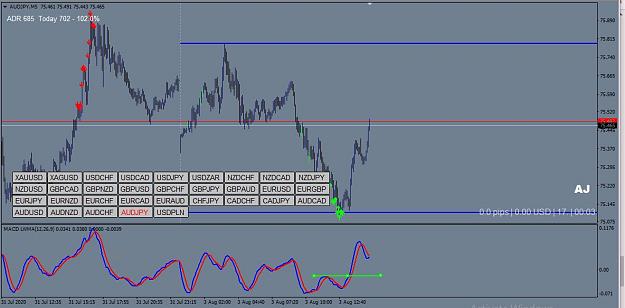
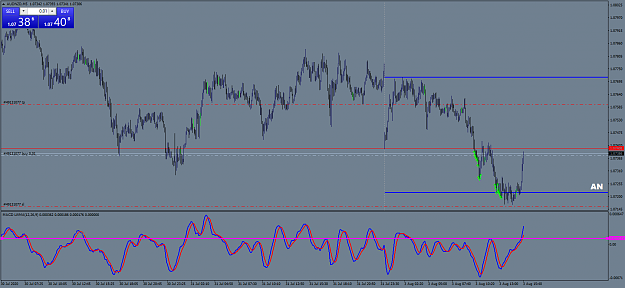
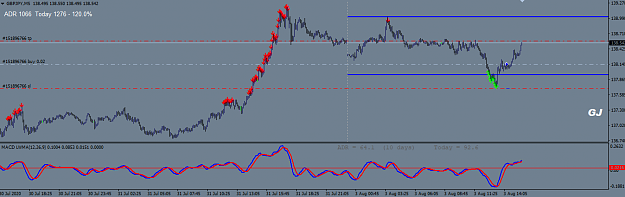
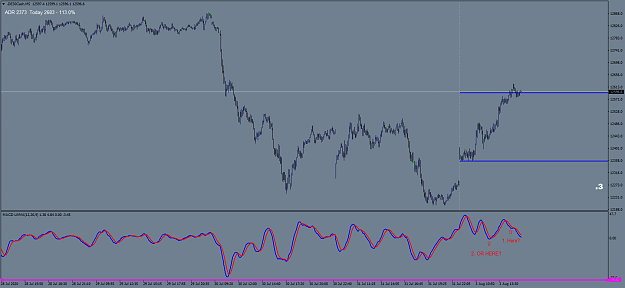
The strategy is a counter trend strategy taking advantage of when a pairs Average Daily Range (ADR) has been exceeded. This along with the RSI being OB/OS on multiple time frames gives a strong probability of a re-tracement or a reversal. When these conditions are met, we use the MACD for the entry.
The great thing about this strategy is that the indicators do the heavy lifting meaning that you dont need to be staring at your chart all day.
VIDEO 2 - MT4 TEMPLATE + RISK CALCULATOR (Released 16th August 2020)
Based on your comments I have provided the MT4 template (download below) I use and the video walks through indicators, settings and why they are important. I also talk more about risk management and provided a simple risk calculator (link below) on how much to risk with this strategy.
I think you will have fun with this strategy. Let me know your thoughts and feedback. I will post some chart examples later today.
Indicators Needed (settings also mentioned in the video and why)
OGT ADR Indicator
OGT RSI MTF Indicator
OGT Trend Dashboard Indicator (New, added 16th August 2020)
LWMA MACD
Indicators Settings
ADR Indicator
- ATR Period: 15
- ADR Alert %: 100
- ADR Alert Email/Push/Popup: True
RSI MTF Indicator
- RSI Period: 14
- RSI Price: Closed Price
- OB Level: 70
- OS Level: 30
- TF Type: Higher
- TF Quantity 1
MACD
- 12,26,9 (default)
MT4 Template
Risk Calculator
https://docs.google.com/spreadsheets...it?usp=sharing
Indicators
I hope you are having a great weekend.
I have got a brand-new strategy that I am seeing great results so far. The system is averaging around 10 pips a day and would like to share the strategy with the community.
VIDEO 1 - STRATEGY / TIME FRAME / ENTRY SETUP & RISK MANAGEMENT (Released 2nd August 2020)
The strategy is a counter trend strategy taking advantage of when a pairs Average Daily Range (ADR) has been exceeded. This along with the RSI being OB/OS on multiple time frames gives a strong probability of a re-tracement or a reversal. When these conditions are met, we use the MACD for the entry.
The great thing about this strategy is that the indicators do the heavy lifting meaning that you dont need to be staring at your chart all day.
Inserted Video
VIDEO 2 - MT4 TEMPLATE + RISK CALCULATOR (Released 16th August 2020)
Based on your comments I have provided the MT4 template (download below) I use and the video walks through indicators, settings and why they are important. I also talk more about risk management and provided a simple risk calculator (link below) on how much to risk with this strategy.
Inserted Video
I think you will have fun with this strategy. Let me know your thoughts and feedback. I will post some chart examples later today.
Indicators Needed (settings also mentioned in the video and why)
OGT ADR Indicator
OGT RSI MTF Indicator
OGT Trend Dashboard Indicator (New, added 16th August 2020)
LWMA MACD
Indicators Settings
ADR Indicator
- ATR Period: 15
- ADR Alert %: 100
- ADR Alert Email/Push/Popup: True
RSI MTF Indicator
- RSI Period: 14
- RSI Price: Closed Price
- OB Level: 70
- OS Level: 30
- TF Type: Higher
- TF Quantity 1
MACD
- 12,26,9 (default)
MT4 Template
Attached File(s)
Risk Calculator
https://docs.google.com/spreadsheets...it?usp=sharing
Indicators
Attached File(s)
Attached File(s)
Attached File(s)
Attached File(s)
Never stop investing. Never stop improving. Never stop doing something new