Hi guys,
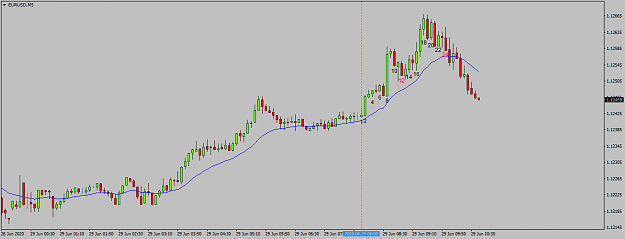
I'm just a trader, not coder and I just want to create an indi for my trading purpose. So I started learning how to code a few weeks ago. Indi which I want to create displays numbers below the bars right at the time I want during the day. Then, it will repeat the next day. You can see the image below (the image has a gray background).
EX: At 08:00, number 1 is displayed on Low of the bar then 2, 3, 4, 5... then at 15:00, it will stop displaying and repeating tomorrow.
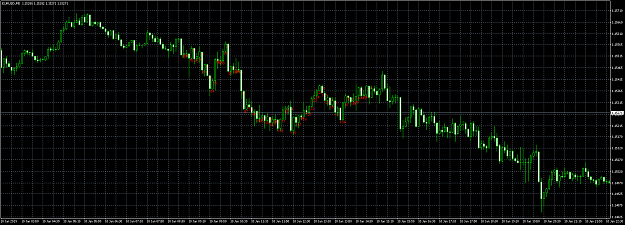
I tried to search and code. When I compiled and tested it (look at the image has a black background):
I'm just a trader, not coder and I just want to create an indi for my trading purpose. So I started learning how to code a few weeks ago. Indi which I want to create displays numbers below the bars right at the time I want during the day. Then, it will repeat the next day. You can see the image below (the image has a gray background).
EX: At 08:00, number 1 is displayed on Low of the bar then 2, 3, 4, 5... then at 15:00, it will stop displaying and repeating tomorrow.
I tried to search and code. When I compiled and tested it (look at the image has a black background):
- The numbers weren't on Low of the bars, they were in the middle of the bars.
- The numbers didn't repeat. They did not go back to number 1 the next day. They just kept moving forward.
How can I fix guys???? Here the code:
Inserted Code
//+------------------------------------------------------------------+
#define HR2400 86400
#define SECONDS uint
SECONDS time(datetime when=0){return SECONDS(when==0?TimeCurrent():when)%HR2400;}
datetime date(datetime when=0){return datetime((when==0?TimeCurrent():when)-time(when));}
//---
bool TradingTime(SECONDS start,SECONDS end,datetime when=0)
{
SECONDS now=time(when);
return start<end?start<=now&&now<end:!TradingTime(end,start,when);
}
//--------------------------------------------------------------------
bool PlotText(string name, bool del=false, int win=0, datetime dt=0, double prc=0, string text="", int clr=0, int size=12, string font="Arial", double angle=0, bool bg=false, ENUM_ANCHOR_POINT anchor=ANCHOR_LEFT_UPPER)
{
if(del)ObjectDelete(name);
win=MathMax(win,0);
if(clr<0)clr=White;
size=MathMax(size,8);
if (ObjectFind(name)<0)
ObjectCreate(name,OBJ_TEXT,win,dt,prc);
ObjectSetText(name,text,size,font,clr);
ObjectSet(name,OBJPROP_BACK,bg);
ObjectSet(name,OBJPROP_ANGLE,angle);
ObjectSet(name,OBJPROP_ANCHOR,anchor);
return(true);
}
int deinit()
{
return(0);
}
//+------------------------------------------------------------------+
//| Custom indicator iteration function |
//+------------------------------------------------------------------+
int OnCalculate(const int rates_total,
const int prev_calculated,
const datetime &time[],
const double &open[],
const double &high[],
const double &low[],
const double &close[],
const long &tick_volume[],
const long &volume[],
const int &spread[])
{
#define HR0900 32400
#define HR1500 54000
if(NewBar()&&TradingTime(HR0900,HR1500))
{
static int count=0;
count++;
PlotText("Number"+(string)count,true,0,Time[0],Low[0],(string)count,clrRed,8,"Arial",0,true,ANCHOR_UPPER);
}
return(rates_total);
}
//+------------------------------------------------------------------+
bool NewBar()
{
static datetime lastbar;
datetime curbar = Time[0];
if(lastbar!=curbar)
{
lastbar=curbar;
return(true);
}
else
{
return(false);
}
}
//+------------------------------------------------------------------+
Attached Image(s) (click to enlarge)