Disliked{quote} thanks for response one picture can you tell you 100 words!. i follow smart money ict orderblock . market consolidate than break up or down and rectagle can measure how many pip?(i know about cross hair) and one more thing market reach to mean that is 50 % of rectagle. now picture which is showing total pips(box/rectagle drawn) and 50%. and more thing if it is possible than share your indicator and template .thanks {image}Ignored
But you can have a look at the version from jeanlouie here - he added a rectangle with your your mentioned 50% level.
For your question regarding sharing my template - I'll will upload it here eventually later... but it's nothing special...
DislikedHey Jagg! when you have some time ..would you be kind enough to add 3 more rectangles and 3 more linesIgnored
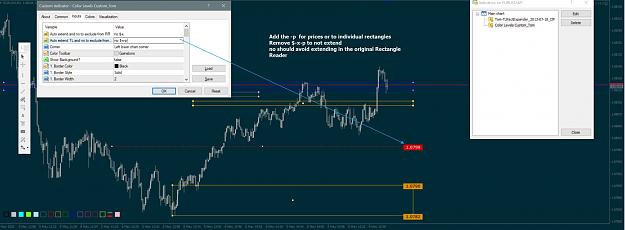
Disliked..and the following inputs?: - the posibility of adding a shortcut for "toogle" object description - the posibility of adding a predefined length ( in periods of the timeframe that they are drawn ) for the horizontal lines and rectangles? Thanks a MillionE.
Ignored
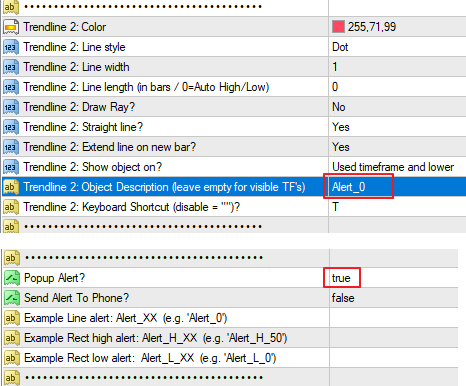
- added keyboard shortcut for toggle the object descriptions on/off (default: "O")
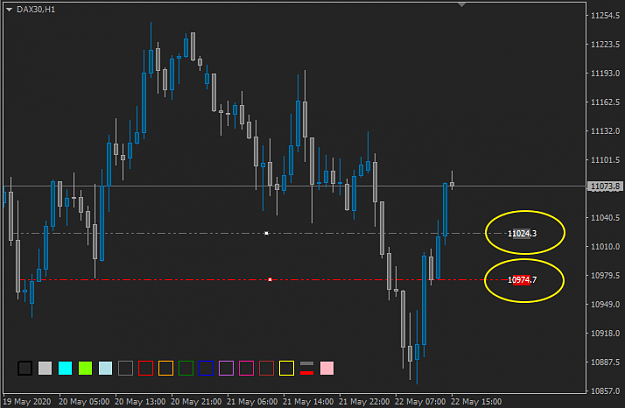
- added width (for rectangles) and length (for trendlines) in bar(s) (when set to "0" -zero- everything is like before)
Also adding here the slightly fixed/changed "timeframe_zoom_per_chart" indicator...
Attached File(s)
4