Disliked{quote} My apology's I thought you had more knowledge on coding. To answer your question LowerTma( timeframe, HalfLength , atrmultiplier, atrperiod , int shift) I will need to set an appointment with you.. We need to agree when we both free and are at our computers and then we hammer away at this thingIgnored
The pattern I noticed on my live account:
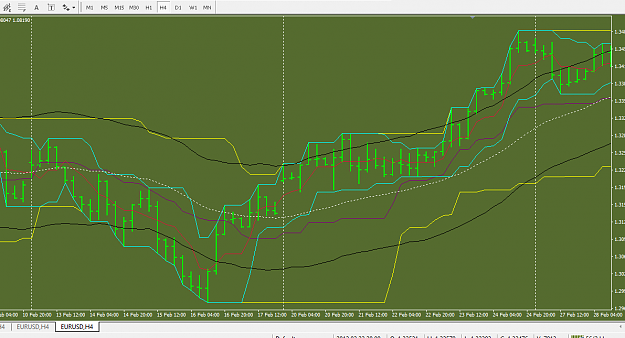
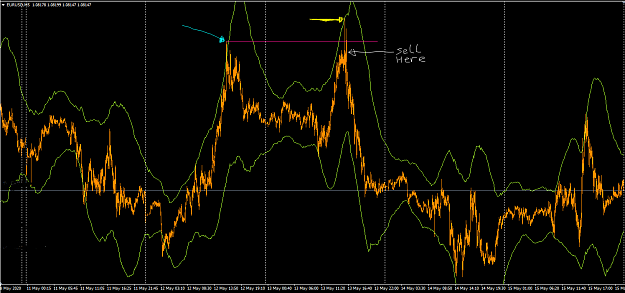
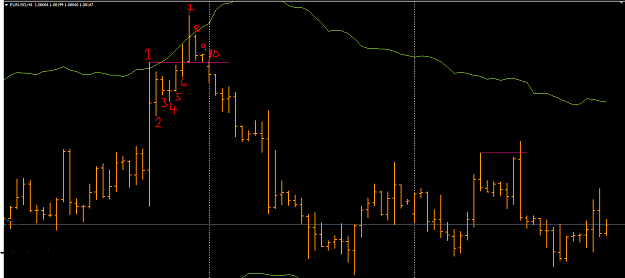
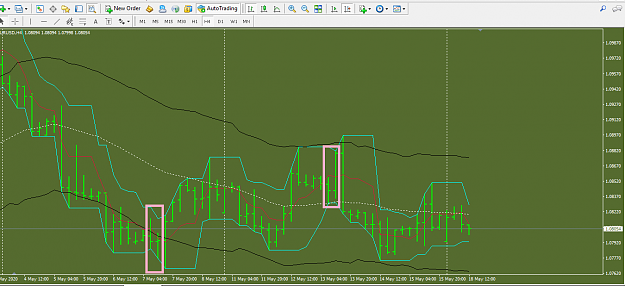
H1 top green TMA band comes inside (crosses) the H4 top gold TMA band = sell opportunity and as per the picture below on March 11th 2020.
Note that the H1 bottom green TMA line remains inside the H4 bottom gold TMA band, this is correct when the sell opportunity arose.
I think the take profit should be when the H1 bottom green line goes outside the H4 bottom gold line.
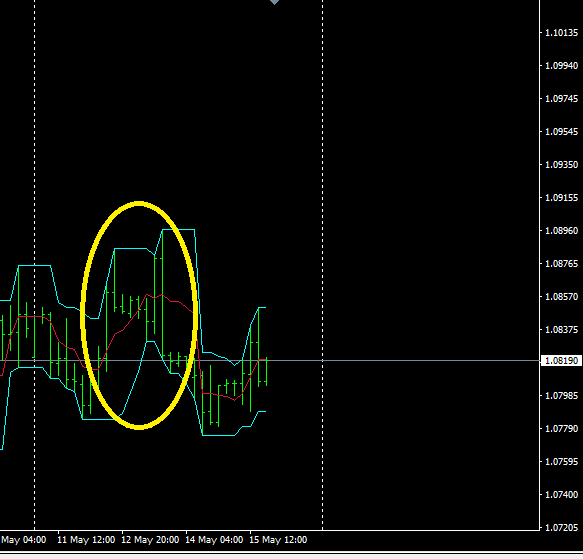
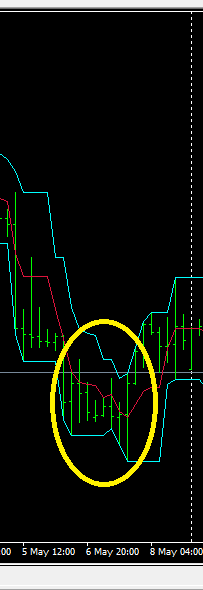
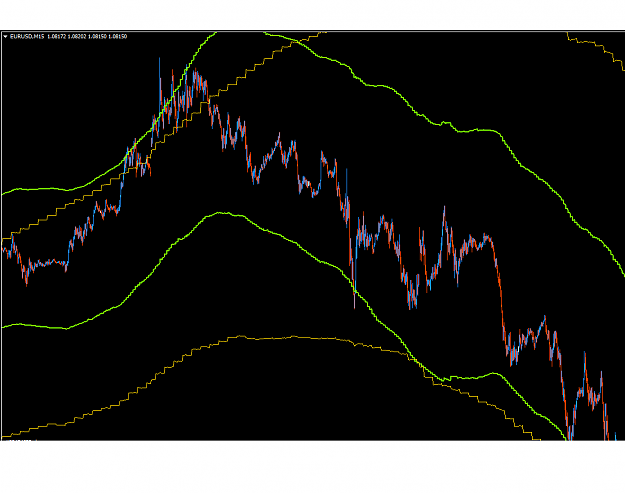
Then we wait for the buy opportunity to occur e.g.
H1 bottom green band comes inside the H4 bottom gold band and the top H1 band remains inside the top H4 band for a buy.
I have uploaded a template as well which i hope explains my madness better.
I'm also testing the other bots that you have posted as I only use a live Oanda account.
Attached Image (click to enlarge)
Attached File(s)