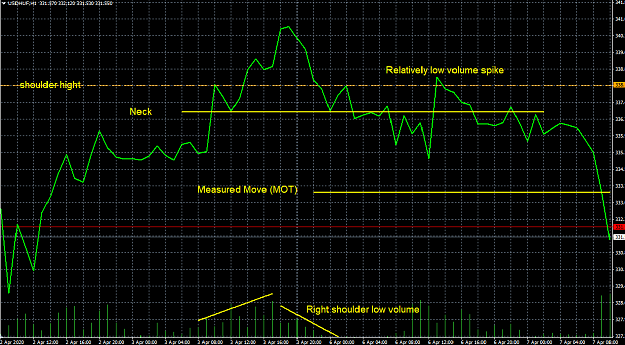
Yes certainly not text book perfect, I simply opened the USDHUF (not something I am familiar with) and saw what jumped out , My understanding is that the H&S is heavily Volume dependent and not as much around the left shoulder and right being of similar magnitude. below is the same chart with a H&S pattern, I simply zoomed in. the lack of volume on the right shoulder rise is a clue to its breaking the neck line. a single spike penetrates the neckline and slightly exceeds the right shoulder before continuing down to meet the original MOT. oddly enough this was the first chart I opened. Not something I would probably trade and I dont usually look for or trade H&S but its been an interesting revisit for me on this case. I haven't read anywhere about the number of touches on the neckline however I suspect this is an important factor as with most drawn lines.
Obviously you don't trade H&S anymore as stated above (given in your book you state that you historically have "In the case of H&S, I prefer to take a new position at the point I expect to see a potential second shoulder top.") do you think they are an over traded pattern and hence dont work or is it that they never really did ?
Obviously you don't trade H&S anymore as stated above (given in your book you state that you historically have "In the case of H&S, I prefer to take a new position at the point I expect to see a potential second shoulder top.") do you think they are an over traded pattern and hence dont work or is it that they never really did ?
Attached Image (click to enlarge)
1