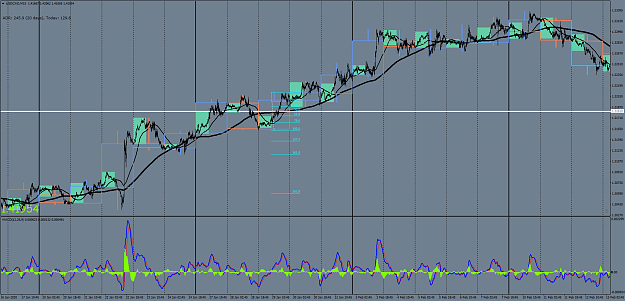
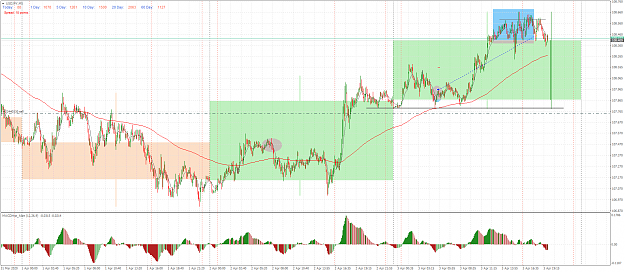
DislikedI got a live trade going atm... usd/jpy long. The daily chart shows I had a nice bullish engulf candle, so it was a easy read to get me indication what direction I need to trade the next day which is today. On the 5m chart Price nicely had pulled back, on the first low I drew my level and watched it for PA reaction, as you see multiple failures. The blue circle is where the entry is off the CC of 10ema. {image} {image}Ignored
Trade well.
Attached Image (click to enlarge)
Nobody ever made a dime by panicking. Jim C