Patters needs to be seen in context and on on their own are mostly 50/50.
Ignored
I got my breakthrough when some experienced veteran pointed to me to directly correlate different aspects instead of seen on their own. It simply changed everything after that. mtf, different parameters and so on.
This might help you too.
I can tell you are so deeply invested into this that failure is not an option.
It's this stoic attitude that propels you cross the line.
That's how success is achieved in business ventures.
When there's no plan B. That brings out the best from us.
{quote} I can tell you are so deeply invested into this that failure is not an option. It's this stoic attitude that propels you cross the line. That's how success is achieved in business ventures. When there's no plan B. That brings out the best from them.
Ignored
Thanks, I appreciate this more than you can imagine. Good to know some has been down the same road.
{quote} It’s your decision entirely as to what works. I have demonstrated a reaction to a historical Low that stopped exactly to the pip. They are areas of stops, that’s all we have to find. Look at price react around a pivot, it’s 50/50 as to what happens next, trendlines... what on earth has a trend line got to do with finding an area of stops? Fib lines, not for me, maybe set TP and SL but again they don’t show areas of stops. Angles of what? Find a reversal pattern back into a ‘trend’ or a reversal against, but note whether there is an historical...
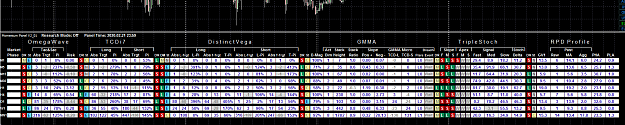
Last but not least, I am also in possession of the holy grail panel. I would like to get back to it one day, otherwise it was a total waste of time. This thing is mega complex w.r.t. coding. Approx 39 files, 20K lines of code. A whopping 434 inputs, can you image? The biggest service that I rendered JT was to implement a research mode, where you can put a vertical line at any bar in the past and get the exact panel values. It has some issues in terms of performance and memory usage in research mode. I don't know if anyone attempted this kind of coding. It is complex to say the least.
I even created an and shared an Excel bridge to export panel data in order to help JT to assist with Metadata analysis, but unfortunately the performance was slow on his side for reasons unknown.
Attached Image (click to enlarge)
No wonder the utter devastation when I left. I hope my successor knows what he is getting into.
Someone has asked me to share it. Unfortunately I am not going to, so don't bother asking.
Last but not least, I am also in possession of the holy grail panel. I would like to get back to it at some time, otherwise it was a total waste of time. This thing is mega complex w.r.t. coding. Approx 39 files, 20K lines of code. A whopping 434 inputs, can you image? The biggest service that I rendered JT was to implement a research mode, where you can put a vertical line at any bar in the past and get the exact panel values. It has some issues in terms of performance and memory usage in research mode. I don't know if anyone attempted this kind...
Ignored
No matter what the argument was about, the work is between you and Jetdude, the honourable course of action is to keep the work between yourselfs, just sort out the issue. Life’s to short.
... what on earth has a trend line got to do with finding an area of stops ? ...
Ignored
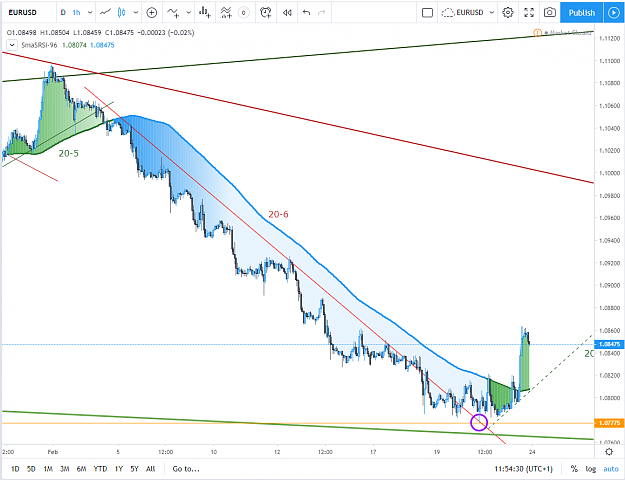
Interestingly, I was tracking a H1 downtrend for a reversal and guess when the trend line was broken and at which point it was tested after the break ?
Maybe trend lines can help for short term direction or it was maybe a pure coincidence, the 50/50 issue as you say...
{quote} Interestingly, I was tracking a H1 downtrend for a reversal and guess when the trend line was broken and at which point it was tested after the break ? Maybe trend lines can help for short term direction or it was maybe a pure coincidence, the 50/50 issue as you say... {image}
Ignored
I would say if you can trade it do so. But place another another trader beside you and his trendlines will differ from yours! The question who is right and who is wrong. The answer of course is both neither right or wrong. Now ask two traders to draw a line on the gap from 3 years ago..both will have the same level to trade from.
{quote} I would say if you can trade it do so. But place another another trader beside you and his trendlines will differ from yours! The question who is right and who is wrong. The answer of course is both neither right or wrong. Now ask two traders to draw a line on the gap from 3 years ago..both will have the same level to trade from.
Ignored
Provided they saw the same gap from their brokers platform.
I have 2 question,
1. how you go about looking for gaps ? Is it h4 and upwards gap ?
2. How often do gaps get filled in a week ? I mean how many trade opportunities a week for the 28pairs ?
{quote} Provided they saw the same gap from their brokers platform. I have 2 question, 1. how you go about looking for gaps ? Is it h4 and upwards gap ? 2. How often do gaps get filled in a week ? I mean how many trade opportunities a week for the 28pairs ?
Ignored
A good start would be to find unbroken weekly high/lows...if you spot a gap, yep, mark that on the chart.
Last but not least, I am also in possession of the holy grail panel.
Ignored
First, you can label it what you want. I've been using it since you quit and have done so with the same results that I posed here in this thread. So, I don't have the same apparent problem that you do with it. That's because I've made changes to the code where necessary (things that did not output correctly based on the written specifications I designed) and I spent the time required to optimize System Configurations that you don't have.
Second, I don't waste my time on a development projects. I especially would not waste my time on something that I knew I could not use going forward. Third, the only devastation was truly enormous. It really was. It was so enormous that I decided to challenge myself by live streaming my own trades using the exact same Panel. So, that was very devastating indeed.
Fourth, there is no quit in success. The very first question I asked you before a single character was typed in MQL, was were you able to handle the massive amount of iteration between Designer and Developer that is required to complete a Project like the EventHorizon. You said, yes. You also stated that you would remain in the project as long as it was of benefit to you. So, on that basis, I decided to work with you. There were at least three (3) other MQL Developers waiting for a response from me as to which Developer I'd be working with. You, were selected from a group of MQL Developers who also wanted to participate in the Project.
Fifth, what you "got yourself into" was access to an experienced Trading System Designer who has built successful Trading Systems before - and you knew that before you got involved. You stated that you wanted to learn more about how I built Trading Systems. You stated that your ability to Integrate Indicators into a functioning Trading System were lacking. This is part of the reason why you claimed you wanted to be involved.
Sixth, your post here demonstrates why you can't use the Panel. You don't use the Panel in the same way (a waste of your time) that I demonstrated here in this thread, because you don't yet understand Indicator Integration from a Systems Theory standpoint - so you are not able to create System Configurations that work for you and you have not yet learned how to Interpret the Panel output. I do and I have, which is explains why I am able to use quite effectively.
Lastly, there is a massive difference between Trading System Design and writing code. We've had this conversation numerous times before and both agreed that the two worlds are simply not the same. Precious few people in this business can do both at a high level. Designing a Trading System, coding that System, implementing that System and then trading that System to a point of consistent profitability sufficient to Grow Capital over time, is territory for the Gods of Trading. Precious few individuals have ALL those skills intact - precious few.
I'm not one of the Gods of Trading. I'm the Designer, Architect and Engineer of Indicator Logic, Trade Logic and Trading Systems Integration Logic. I am the Trader and Account Manager. I Grow Capital. I do not have Coding skills sufficient to encode a Trading System. Likewise and by the exact same token, you are not a God of Trading. You do not possess all the skills necessary. You were good MQL Developer. You were a good Indicator Coder. But, that's where your skill set came to an abrupt end. You did not have the skills necessary to visualize HOW to Integrate those Indicators into a singular unit called a Trading System. THIS is WHY Designers work with Developers. They leverage off of each others skill sets to fill the void where they lack skill, knowledge and expertise.
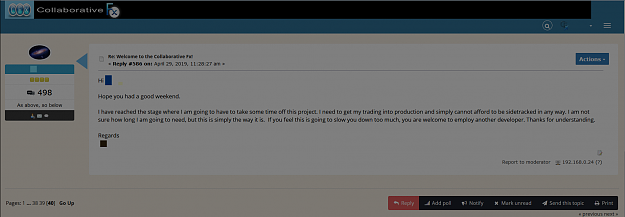
For you to come here like this and post this insinuating bullshit is well outside of what I expected from you. You decided to quit the Project citing personal reasons here:
Attached Image (click to enlarge)
A) You were never "employed" (nobody was employed and you knew that fact before you made this post)
B) As the Project Forum Logo says, the Project was an open Collaborative effort (there were no employment contracts)
C) The Collaborative was Voluntary (you participated because you wanted to)
C) You were not providing a "Service" as you have claimed in this thread (very poor choice of words and very misleading)
You quit because you said you needed to get your own trading into "production." You then said that you could not "afford to be sidetracked." Ok, so, if ya knew the Project was sidetracking your own production trading, why would you agree to get involved in a Collaborative effort to begin with from the start. This post on the Project's Forum (The Collaborative) is indicative of someone who thinks and believes that what they are contributing is somehow exclusive, not replaceable and that their efforts are the only input to the Project's success. This tone and language is indicative of someone who things they are giving away something for free.
Let me straighten you out on a universal truth about collaborative trading projects: There is nothing to code until there are specifications on the table and a design to back them up. You can't code what does not exist. Period. Somebody has to do the work and put forth an intelligent Design, before that design can be coded. It does not work the other way around. Nobody dreams up random code and then by some miracle turns it into a Tool used to trade. Design comes first, then the Coding comes after. There may be only one (1) Designer, but there can be many Coders.
The "holy grail" works just fine for me as this thread attests (just go review the trades results in this thread). That's because I am its Master Architect. Therefore, even though this "holy grail panel" (as you labeled it) is only at the Proof Of Concept stage, I specially designed it to be a Functional Proof of Concept, whether you were aware of that fact or not. This is why I made it Configurable.
There are people that spend many years developing their trading tech before it becomes useful to them on a consistent basis. Those people understand the enormous time it can take to finally deploy something that works into the Markets. There are also people that don't understand this fact. They think that you can somehow place a time table on what has to be one of the most difficult and challenging Technical endeavors that any Industry could ever have. Creating a Trading System takes time.
This Project started out quite different from the way it ultimately ended up. I went out and purchased computer hardware, two (2) VMware Workstation Pro Licenses and then built a T1 bare metal hypervisor using ESXi 6.5, installed dedicated Forum software and a dedicated FTP server - all for the sole purpose of making sure that we had a smooth and efficient means of collaboration restricted from the outside world. Inside that environment, I created virtual machines on a vm network for the purpose of making sure we had ample space to Develop the Project in any way necessary.
You have NEVER worked with a Trading Systems Designer on a Project this sophisticated before in your trading life. I provided a foundation upon which such a Project could flourish. You decided to quit and then come here and post an insinuating and misleading piece about how much a waste of time you suffered. Hmmmm. This is the "rest" of the story. There's always two sides to a story.
PS.
It took me two months to finish three (3) different System Configurations that allows me the freedom to use the System for Scalping, Intra-Day Trades and Swing Trades. They all work great and all three were used in this thread. GBPCHF used Configuration Charlie. EURAUD used Configuration Bravo. EURUSD used Configuration Alpha. This not the Alpha Configuration that I gave you via email when you asked me for it - after you had officially quit. Alpha Configuration has been significantly (heavily) edited. Configurations Delta and Echo are next. They will be configurations that work with iRPD Profile and iGMMA Composite.
Those Configurations I would have freely given you. However, your participation in the Collaborative Project ended. The Project was always a venture that consenting adults freely involved themselves with. You don't owe me anything for what you learned from me (the Indicators you were given, the concepts you learned from me, etc.). Nothing at all. And, I don't owe you for the code you wrote. Nothing at all.
If I were you, I would seriously reconsider whether or not Trading is the right career. The very first rule of the Trader is to first be true to thyself. That means, being honest with yourself, so that you can be honest in your trade decisions. Deluding oneself or lying to oneself as a natural way of being, will ultimately leak into Trading Decisions and that is what is truly devastating.
...Someone has asked me to share it. Unfortunately I am not going to, so don't bother asking.
Ignored
More useless insinuation. You're a real winner. I'm 100% certain your Trading Career will get off the ground. However, even if you did "share" the "holy grail" with someone, they too would be absent the fixes I had to make to get some of the output corrected and they would also be absent the System Configurations that make it optimized for real trading.
This is the part you never seemed to understand which I found amazingly bizarre since I repeatedly told you that the development of the System required Optimization. You cannot Optimized an unfinished System. That's why it took time to get to that point. This is precisely the kind of thing that separates Trading Systems Engineering from Developing and writing Code. The Systems Engineer understands Process and Integration. They are not myopic in their focus, they have to focus on the small things as well as the larger things - both at the same time. They have to be able to visualize things that do not yet exist an then forge them into existence through Design and Architecture.
You bailed right before the very last step and then you claim here that unless you get back to it, it would be a huge waste of your time.
Not a waste of my time! I love the System. It works like a true Swiss Army Knife. I can do many different types of trades with it with a high level of comfort. I demonstrated that in this thread and I will be demonstrating more of that in live stream.
Your veiled threats about sharing it with someone don't bother me. I know what I'm doing with the System. You can also "share" an IndyCar with someone, too! If that car is not Configured right for the track (and all race car drivers know this fact), you won't get the performance you came looking for. Share that same IndyCar with a non-race car driver and they could kill themselves with it because they don't know what they are doing and they don't know what they are driving.
I've shared many of my trading concepts in public. I shared them with you.
@wanderer @JetTrader It would be better to take your differences outside of FF. M.
Ignored
I did not bring differences in here to FF, he did.
I brought Trades as the OP requested, but of course, those trades got ignored (as they always do) because they disproved the fallacy of the OP itself. You don't see anywhere in this thread where I brought anything other than Trades, until Trolls got involved.
So, if differences are what you truly care about taking outside of FF, then address the Trolls who derailed the thread. Otherwise, all my Trades here remain extant, without blemish and directly in-line with what the OP required.
People love to pretend they can't read for themselves. If you are on a forum that requires actual reading and you fail to read what's actually been posted in context, that is the fault of no one other than those who cannot, do not and refuse to read.
The record in this thread (and all others) is quite clear.
1) I post pictures
2) I talk about my Trading System
3) I get called out to post Trades
4) I (with great joy) answer the call
5) I post Trades with Updates
6) Trolls enter stage right (precisely on cue as they always do)
7) I dispatch Trolls while seamlessly Updating Trades
8) Forum Cops suggest I'm being to harsh on correcting the Professional Trolls
9) Trades complete and Results are posted
10) Dead silence from the Professional Trolls and Naysayers about the Trades
11) Developer of the System chimes in that he wasted his time and hopes that other Developers know what they are getting into
12) Unethical Developer gets corrected on the merits of what actually happened, not his delusions about what happened
13) Forum Cop suggests both the System's Designer and System's Coder take their "differences" outside FF
If I've seen similar scripts like this on Trading Forums over the past 17+ years before, then I've seen these scripts play out on Trading Forums across the planet at least 40 million times before.
What's new after 17+ years in the Trading Community? Answer: Absolutely, zero.
This is precisely why I stopped coming to places like this.
There is no Trading going on and no real discussion of Market Structure and how to take advantage of it.
Word to the New Traders: You desperately need to be in an environment outside of places like FF, where you can glean from and be inspired by real Traders doing the real business of Trading.
{quote} I did not bring differences in here to FF, he did. I brought Trades as the OP requested, but of course, those trades got ignored (as they always do) because they disproved the fallacy of the OP itself. You don't see anywhere in this thread where I brought anything other than Trades, until Trolls got involved. So, if differences are what you truly care about taking outside of FF, then address the Trolls who derailed the thread. Otherwise, all my Trades here remain extant, without blemish and directly in-line with what the OP required. People...
Ignored
Funny that, I started a reply then saw that you have answered my question.........
I tried to follow your explanation of how you took a trade off of your dashboard, and must admit, I stopped reading at the first sign of gamma waves, theta bounces, oscillating jockstraps.
I just drew a line on a chart. That worked.
We are done.
Ignore button activated, not how I would like to interact in FF but sometimes the Bullshit Meter hits a home run.
{quote} Funny that, I started a reply then saw that you have answered my question......... I tried to follow your explanation of how you took a trade off of your dashboard, and must admit, I stopped reading at the first sign of gamma waves, theta bounces, oscillating jockstraps. I just drew a line on a chart. That worked. We are done. Ignore button activated, not how I would like to interact in FF but sometimes the Bullshit Meter hits a home run.
Ignored
On a serious note: gamma waves and theta bounces work, but only in conjuction with Sagitarius and Aquarius during a 12.9 months cycle
PS can you share this Bullshit Meter?
On ignore list of scammers, deceivers and low IQ individuals. Exclusively
{quote} Funny that, I started a reply then saw that you have answered my question......... I tried to follow your explanation of how you took a trade off of your dashboard, and must admit, I stopped reading at the first sign of gamma waves, theta bounces, oscillating jockstraps. I just drew a line on a chart. That worked. We are done. Ignore button activated, not how I would like to interact in FF but sometimes the Bullshit Meter hits a home run.
Ignored
You did better than me.
I don't understand one bit of the dashboard, way over my head stuff. So I must admit I didn't try at all.
{quote} You did better than me. I don't understand one bit of the dashboard, way over my head stuff. So I must admit I didn't try at all.
Ignored
Just high low open close rehashed into a dash designed to give a trader a warm fuzzy feeling......like all of these products.
I’ll say it again. No one knows where the Algo is heading. We cannot see the book, until then, it’s best guess.
Find the stops.