DislikedI have used this since the beginning more or less, but for some reason all volume plotting went flatline the 5 of july. Havent changed any settings in the ini file and the program is still gathering the volume info in the csv files. Anybody else have the same problem? I have updated the exe file when a new have come along. I can plot everything but the net-, total-, short- and long- volume of any currencypair. Im using the Hanover templates but this is what I get.Ignored
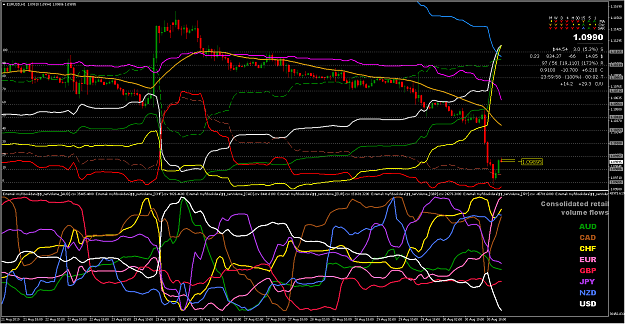
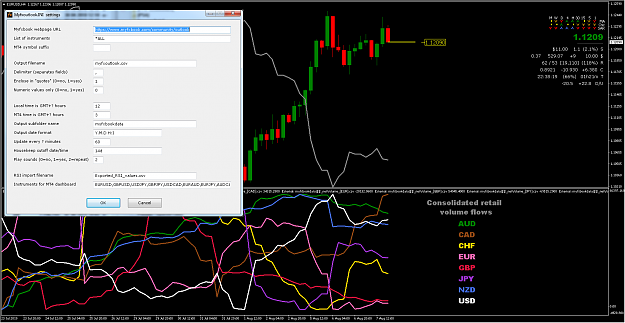
Here is my chart as it currently stands, and the parameter settings that I'm using. I simply opened a H4 chart, applied the 'myfxbook consolidated' template, and toggled between timeframes to force a refresh of the indicators.
Attached Image (click to enlarge)
It looks like your computer is no longer gathering data. You could try stopping and restarting the download app. If the the myfxbook icon is absent from your systray, the app is not running. You could also view the csv files in the …/MQL4/Files/myfxbookdata folder, to see when the last datapoints were downloaded (at the end of each file).
If you post a screenshot of your ini file settings, I'll try to see if there's anything that looks amiss. Otherwise, all I can do is point you back to all of the responses in post #1, and the 'Troubleshooting' section of the PDF. After that, I'm afraid I've run out of ideas.
_____________________________
DislikedAny chance we could get you to add alerts(Message, Sound, Push etc..) to the 30,50 and 70 level crosses.Ignored
I'm very sorry, but I don't want to set a precedent where everybody starts sending me coding requests again. I guess I'm my own worst enemy by posting the indicator in the first place, lol. I really should take my own advice and stop posting here!!
I've posted the mq4 file, in case another programmer wants to tackle it, but I'm afraid it's written using MQL4 build 509 and my own coding libraries, so this necessarily applies. Also, push notifications are not available in build 509. Hence the best approach might be for somebody to rewrite the indicator using the current build (please feel welcome to copy the RSI calculation from my code).
Attached File(s)
David
_____________________________
DislikedIts turning into a hanover lovers club and not what this thread is about..Ignored
DislikedIf Hanover wants to try and prove it doesn't work I won't stop him....Ignored
It's highly possible that I've misunderstood the specifics of your strategy: how you use the myfxbook data and RSI to choose pairs and time your entries. Anyway, my comments were intended to relate only to the general use of the myfxbook data. The software that I posted simply takes the myfxbook data exactly as it is, and plots it as a dashboard or timeseries, whatever you wish. The RSI indicators that I posted are open-ended enough to accommodate a range of settings (you can enter up to 9 MT4 timeframes, and up to 10 different periods for each timeframe). I've never recommended that anybody uses this software as the basis for any kind of strategy; I'm merely sharing it in case anybody finds it useful or interesting.
Trading forums are a sinkhole, the discussions always end up revolving around personalities rather than strategy. The last thing I want to do is to become a focus for contention. Again, I should take my own advice and exercise the discipline needed to quit this place!!
DislikedIt is the way we have been wired, to look for loop holes without trials, ....... Peeps forget that you only need conservatively a strategy that works 55% of the time with good risk management to be successful in fx. ...... If the understanding is from this basis, I believe we can significantly increase our odds for success. The approach in my own opinion is, whatever the strategy shared, how can I improve the body of knowledge or make it work for me else I disregard. Every strategy is personal.Ignored
From what I've seen, many novices tend to seek out a self-proclaimed expert, or a set of defined rules, that they can follow mechanically, presumably to reduce ambiguity (well explained here) and personal responsibility from the trading process. I'm not saying that it's completely wrong — I was there myself once — but nowadays my approach is different: I scour forums for ideas, especially those that can add price-independent confirmation, to my arsenal of tools. The myfxbook data meets this requirement.
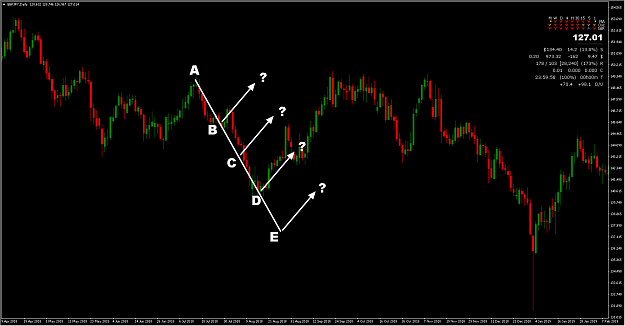
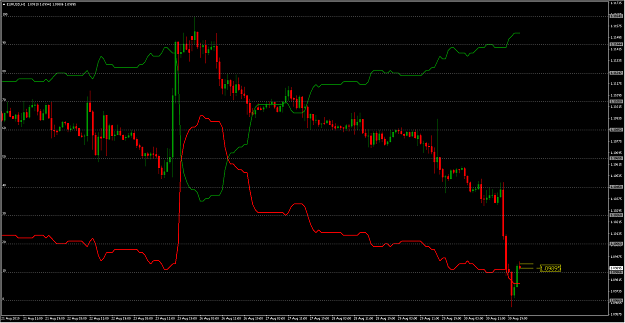
Here is an example where selling when myfxbook buy volumes were at 70% (candle 'A') would have been a great entry, while waiting until it reached 90% (candle 'B') meant entering the move too late, at a local bottom. On a different day, the downmove might have continued, and hence entering at 'B' would have worked out fine**. The point being that it comes back to the percentages that you mentioned: a 60% win rate with solid MM is good enough; 70% is pure gold. A strategy can't be proven to work on the basis of half a dozen winning trades. As the saying goes, 7 wins out of 10 could easily be the result of 'beginner's luck'; 700 wins out of 1,000 is more likely to be the product of some kind of expertise.
[** as it turned out, if you'd sold at 'B' with a wide enough SL (say 150 pips), you'd be ahead more than 250 pips as of now. If you'd sold at 'A', you'd be ahead more than 450 pips. Neil seems intent on demonstrating that 'contrarian' trading 'works', while the wordpress blogger is intent on proving that it doesn't. My conclusion is different to both of theirs: I believe that the myfxbook data is a decent confirming, but not necessarily a leading, price-independent indicator; and that whatever approach you use, P/L ultimately comes down to trading horizons, and timing of entries and exits. The example is a good illustration of this. Like you say, every strategy is personal.]
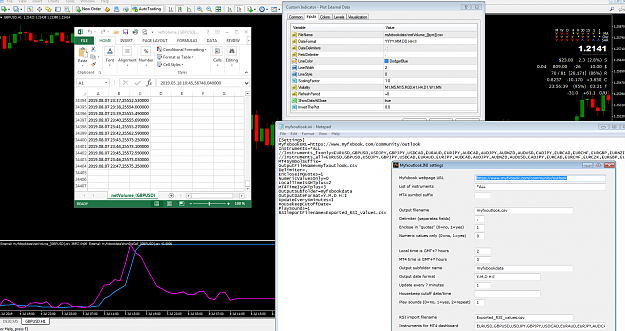
DislikedIt is gathering data in the csv file as it should, but the indicator isnt plotting it. Could be something I have done wrong during an update of the program.Ignored
Thanks for the detailed screenshot, which gives me a starting point to work from. I can't see anything obviously amiss. However, your setting for 'Update every ? mins' is 1, which means that new entries can be added to the CSV files every 1 minute. This results in large files (the one in your XLS screenshot has 34,400 rows!) which could potentially be difficult for MT4 to handle.
The 'Housekeep cutoff date' is a potential solution. If you enter something like 2d or 12h for example, it will cause the download app to automatically take any rows that are more than 2 days, or 12 hours, old, and move them from the .CSV file to an .ARC (archive) file, with otherwise the same filename. Every time the download process reads myfxbook (every 1 minute in your case), the dates on these rows will get checked, and anything that's too old will be automatically archived. The PlotExternalData.ex4 indicators read only the CSV file, which is now at a manageable size.
The myfxbook values don't change that often. As can be seen from my screenshot, I have it updating once per hour and retain only the last 14 days' worth of data for plotting. There's nothing wrong with having it update every minute, but I would set the Housekeep cutoff date to something like 6 hours, in that case, to keep the amount of data more manageable. So I would change its value, and see if it fixes the flatlining.
The 'Housekeep cutoff date' is explained further on page 16 of the PDF. (Incidentally, if you make a mistake, and want to reverse the process, there's an app Unarchive_myfxbook_files.exe which will return the data from the ARC files back to the CSV files. For more info, see the last section of page 21 in the PDF).
Also, keep in mind that the MT4 chart subwindow is limited in height, and the PlotExternalData.ex4 indicator has to scale it all so that the max and min data values both fit inside the window. Hence if there are large amounts of data, and there isn't much change in a succession of values, they are necessarily going to plot in a relatively straight line. For example, the volumes in your screenshot XLS are around 25,575. If the lowest of the 34,000 values was (say) 5000, and the highest 40,000, then the window would be scaled to fit values between 5000 and 40,000, which means that minor variations around 25,575 would plot as something approaching a straight line.
I don't know if what I've described is the cause of your problem, but I can't see any other reason for it in your screenshot. So I would stop the download app, and then restart it and enter a value like 6h into 'Housekeep cutoff date', give it a few minutes and see if the plots sort themselves out. You might need to reload the template, or toggle between chart timeframes, to force a refresh of the indicators. Good luck.
David
3