{quote} That is not enough information. You need to specify a market/instrument and timeframe. I say GBPJPY is in an uptrend/ rally on H1 timeframe. And at this exact moment, in a downtrend/pullback on m15.
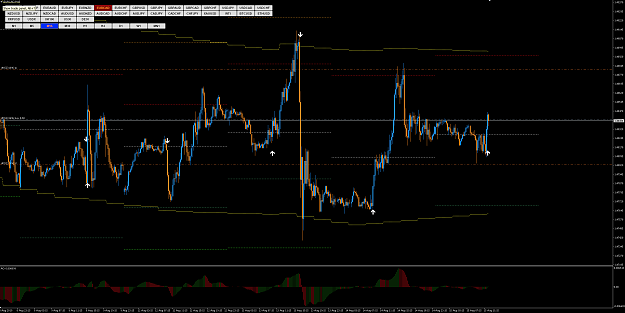
i'm in USDCAD trade as you can see steps are becoming uptrend so tp1 {image}
Ignored
Very good! You see the price fell back from the upper band, but not very far, then started back up and an arrow painted. That was price making a pullback in the uptrend, and then the arrow to buy is the continuation back up. However, did you understand that this is what is happening, or did you blindly buy because of an uptrend and the arrow?
If you remember, when price reaches the upper band, this is far away from where it normally is, so sell trades are preferred, not buys.
{quote} Very good! You see the price fell back from the upper band, but not very far, then started back up and an arrow painted. That was price making a pullback in the uptrend, and then the arrow to buy is the continuation back up. However, did you understand that this is what is happening, or did you blindly buy because of an uptrend and the arrow? If you remember, when price reaches the upper band, this is far away from where it normally is, so sell trades are preferred, not buys.
{quote} but the rules says its preferable not to take a buy trade when price/candle is that close to the upper bands
Ignored
i said that actually
but here if you realise the following
price have been ranging before and then an up trend is starting to form as you see in the picture
when a signal occur at upper band in an upper trend that has been going for a long time then it's not preferable to buy because you are buying at the highs of the wave and not at the pullback like on the example of AUDCAD
{quote} He is using only the rules and tips in post #1. There is nothing about being close to the upper is better to sell. That is just remarks in the thread.
Ignored
i never said its better to sell when price is close to upper band even when clearly its an up trend without a sell arrow, i was just stating that buying too close to an upper band gives a higher risk of a drawdown
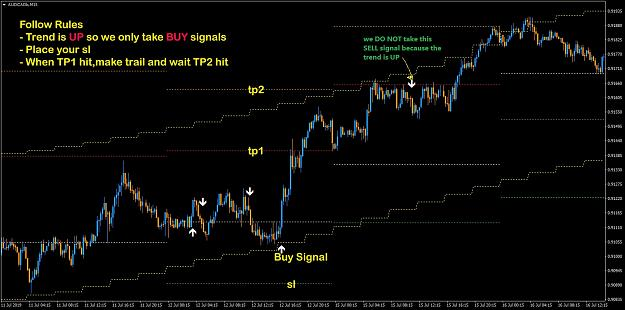
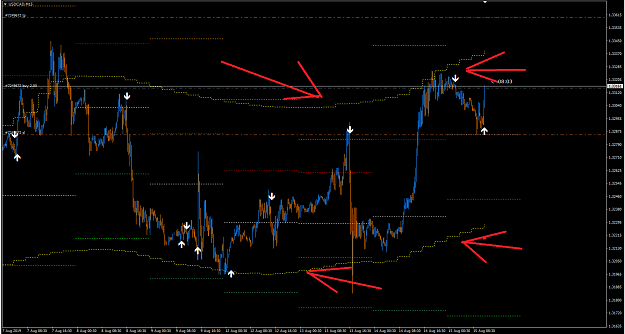
{quote} i said that actually but here if you realise the following price have been ranging before and then an up trend is starting to form as you see in the picture when a signal occur at upper band in an upper trend that has been going for a long time then it's not preferable to buy because you are buying at the highs of the wave and not at the pullback like on the example of AUDCAD {image} {image}
{quote} i said that actually but here if you realise the following price have been ranging before and then an up trend is starting to form as you see in the picture when a signal occur at upper band in an upper trend that has been going for a long time then it's not preferable to buy because you are buying at the highs of the wave and not at the pullback like on the example of AUDCAD {image} {image}
Ignored
You are exactly right with that analysis. However, BTM did not explicitly cover this, so no rule and no tip about it, so people won't be doing it.
Nice one!
It would help other people if you zoom out a little bit to show more of your screen.
Also, if you have the time, include the reasons that you took the trade. For example.
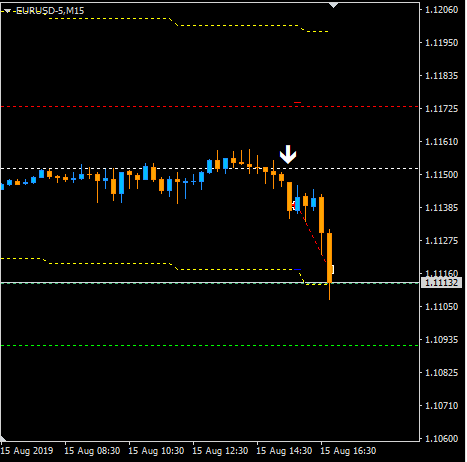
Trend indicator: making steps down = downtrend.
Down arrow displayed = sell
Price went below the base line (not required, but makes better sell trade)
SL: set to line above the base line
TP: set to line below the base line
{quote} Nice one! It would help other people if you zoom out a little bit to show more of your screen. Also, if you have the time, include the reasons that you took the trade. For example. Trend indicator: making steps down = downtrend. Down arrow displayed = sell Price went below the base line (not required, but makes better sell trade) SL: set to line above the base line TP: set to line below the base line
Hi FF memebrs. I like to share with you my trading system . I call it "Beat the Market " the system is very easy to use . I will demonstrate how to use . in this system, we follow the trend that determined on H4 timeframe,so the advantages of my system is following the trend . and the important things here is we work on M15 timeframe .so we catch trend from H4 and trade on M15 . another advantages is,there is no repaint in my system,when arrow appear wait to current candle closed,when candle closed,no redraw no repaint no back paint...
Ignored
Hi, thank you for sharing. I have a question tho. Does it lag in providing arrow signals? Thanks.
{quote} those things are visible in the chart posted did you take the e/g sell?
Ignored
Of course they are visible. The point was so you repeat the steps you took to see if you followed the rules. It also reinforces this in your mind so eventually, you don't need to see a list of rules. Even if you are far advanced from this, it helps other people here.
No, I did not take that trade. I was away from the computer then. Anyway, I have met my weekly goal so I don't really need to take any more trades this week.
{quote} Of course they are visible. The point was so you repeat the steps you took to see if you followed the rules. It also reinforces this in your mind so eventually, you don't need to see a list of rules. Even if you are far advanced from this, it helps other people here. No, I did not take that trade. I was away from the computer then. Anyway, I have met my weekly goal so I don't really need to take any more trades this week.
Ignored
But only posting a trade that is valid can also teach others. Because they got to find out themselves, which reinforces it even better. That´s why courses are built like that at the university, in college etc..
{quote} good trade i was out so did not know about it that's the problem a dashboard will hopefully fix this problem of not sitting at the screen
Ignored
you can receive alert notifications to your mobile mt4 or by email.just set true in signal indicator (F) and complete setting in your mt4. of course you need to stay run your pc or use vps.
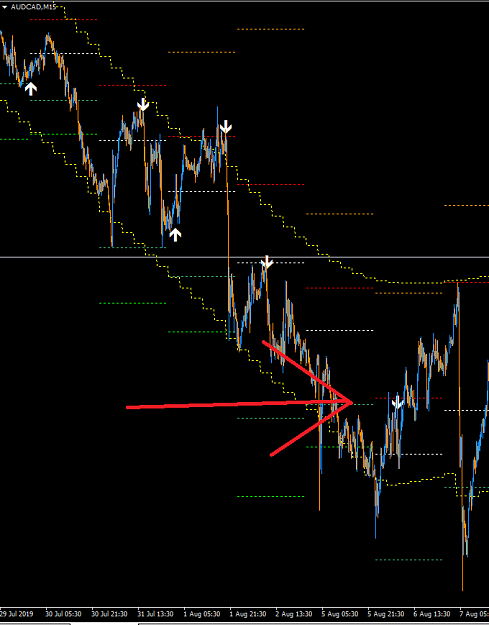
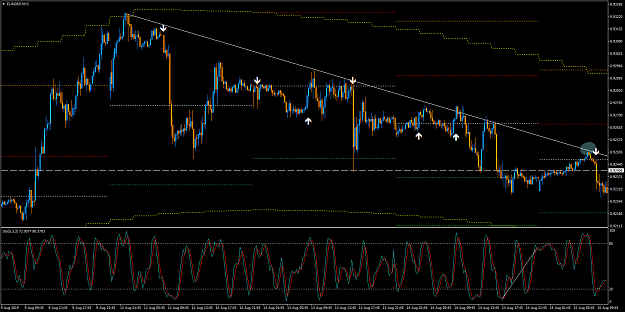
here's an idea. the trend indicator bands could be used a dynamic Support and Resistance. We can use them in confluence with divergence and a breakout price pattern to spot reversals movements. Here i spotted a Regular divergence (stochastic) at the lower band of the trend indicator (support), now i'm waiting for price to breakout the current choppy area which is on a resistance (price action). A safe Target would be at the trend line if it gives a positive R:R by the time the breakout happend (if it happend) {image}