Wanted to see if I could use Paint instead of Snagit. I can't. At least not well.
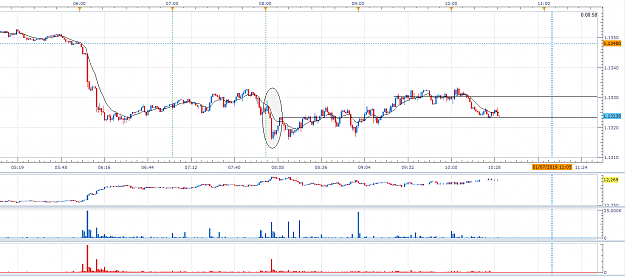
Such a great chart.
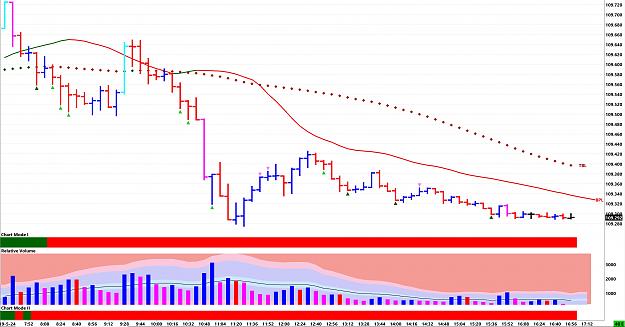
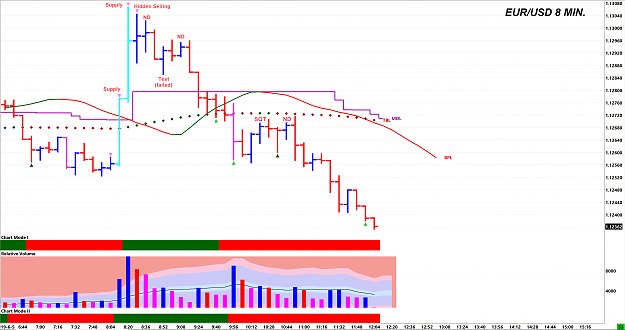
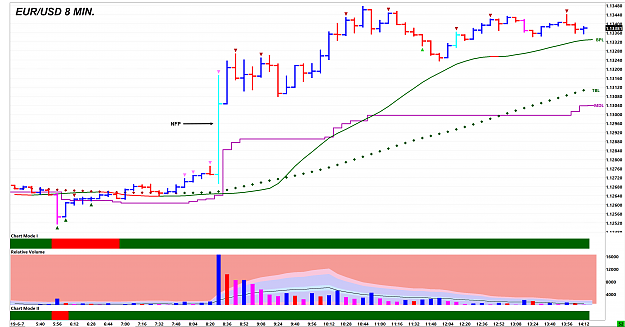
There's no text on the chart, but you almost don't really need any to follow.
Background
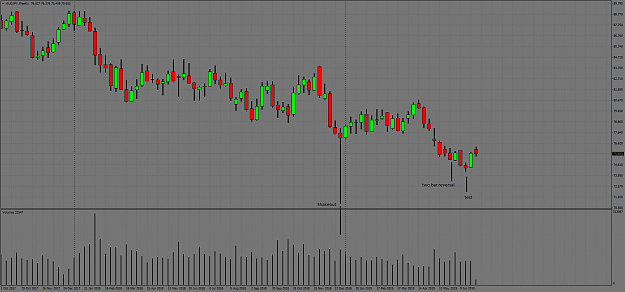
The first thing we see on the left side of the chart is a beautiful Two Bar Reversal (TBR). We see a Wide Range (WR7) UP bar on increasing volume that closes on its high. Which is immediately followed by a Wide Range (WR7) DOWN bar on increasing volume. Although this interval closes off its lows, the next bar closes DOWN confirming the weakness.
We don't get short here, as price is not below the TBL and the BPL and Chart Modes I & II are not both red.
Foreground
Obviously, this is a hindsight chart, but we want to distinguish the first sign of weakness that puts us on alert (the Background) from subsequent signs of weakness that may act as points of entry.
After price closes below both the TBL and the BPL and Chart Modes I & II turn red, we see another Wide Range (WR7) UP bar on high volume that closes on its high. In general, markets do not like widespread UP bars on high volume. The next interval is DOWN, which tells us that there must have been "hidden" selling on the previous bar. If all that volume represented strength, how could the next bar close DOWN?
We also note that this WR7 UP bar is attempting to move into the range of the Previous WR7 DOWN bar of the TBR.
Five intervals later, Yahtzee!
After moving DOWN, we see price move UP on an increasing range bar with volume less than the previous two bars that closes in the middle of its range. This interval is either No Demand or No Buying Pressure. Most will think No Demand, but since the range is increasing rather than decreasing, No Buying Pressure is technically more correct. Either way, this is a weak bar in a Down Trend with weakness in the Background. We can also note that the WR7 UP bar's midpoint (50% Fib level) is acting as a resistance level here.
We can wait for the next bar to close DOWN to confirm the No Buying Pressure sign of Weakness and then enter, or we can place an entry order at the low of the No Buying Pressure interval as a more aggressive entry.
Another nice entry occurs when we see a narrow range UP bar on increasing volume. This is a Squat. Volume is increasing but the range is compressed. What could be the reason for this? VSA tells us (as does Bill Williams) that the range is compressed because all the buy orders are being immediately filled from a large pool of sell orders positioned at the level. Not so coincidently, this Squat is appearing at the midpoint of the most recent WR7 DOWN bar, which represents a key change in the Supply/Demand dynamic in the market.
Such a great chart.
Attached Image (click to enlarge)
There's no text on the chart, but you almost don't really need any to follow.
Background
The first thing we see on the left side of the chart is a beautiful Two Bar Reversal (TBR). We see a Wide Range (WR7) UP bar on increasing volume that closes on its high. Which is immediately followed by a Wide Range (WR7) DOWN bar on increasing volume. Although this interval closes off its lows, the next bar closes DOWN confirming the weakness.
We don't get short here, as price is not below the TBL and the BPL and Chart Modes I & II are not both red.
Foreground
Obviously, this is a hindsight chart, but we want to distinguish the first sign of weakness that puts us on alert (the Background) from subsequent signs of weakness that may act as points of entry.
After price closes below both the TBL and the BPL and Chart Modes I & II turn red, we see another Wide Range (WR7) UP bar on high volume that closes on its high. In general, markets do not like widespread UP bars on high volume. The next interval is DOWN, which tells us that there must have been "hidden" selling on the previous bar. If all that volume represented strength, how could the next bar close DOWN?
We also note that this WR7 UP bar is attempting to move into the range of the Previous WR7 DOWN bar of the TBR.
Five intervals later, Yahtzee!
After moving DOWN, we see price move UP on an increasing range bar with volume less than the previous two bars that closes in the middle of its range. This interval is either No Demand or No Buying Pressure. Most will think No Demand, but since the range is increasing rather than decreasing, No Buying Pressure is technically more correct. Either way, this is a weak bar in a Down Trend with weakness in the Background. We can also note that the WR7 UP bar's midpoint (50% Fib level) is acting as a resistance level here.
We can wait for the next bar to close DOWN to confirm the No Buying Pressure sign of Weakness and then enter, or we can place an entry order at the low of the No Buying Pressure interval as a more aggressive entry.
Another nice entry occurs when we see a narrow range UP bar on increasing volume. This is a Squat. Volume is increasing but the range is compressed. What could be the reason for this? VSA tells us (as does Bill Williams) that the range is compressed because all the buy orders are being immediately filled from a large pool of sell orders positioned at the level. Not so coincidently, this Squat is appearing at the midpoint of the most recent WR7 DOWN bar, which represents a key change in the Supply/Demand dynamic in the market.
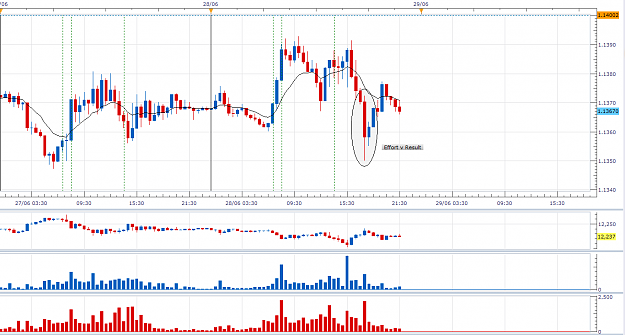
Wyckoff VSA: (1) Supply & Demand (2) Effort vs. Result (3) Cause & Effect
4