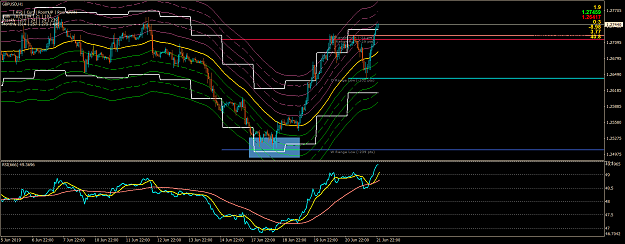
DislikedI already share this sweetspot indicator in R4M thread, but I will share it again here in my own journal As we know, Chartist basic skill like the core name 'chart' or 'map' is 'area mapping.area charting'. Grid is part of 'area mapping' and grid should always consist of 2 parts, Time range and Price Range. the range shape will be rectangles or squares and the correlation/interaction between axis will be diagonal / triangles. GBP/NZD H1 SweetSpot Area Mapping Price Range Grid {image} Let apply this SweetSpot Indicator with example setting above,...Ignored
Yet again you have ALL BASES COVERED as usual, thank you for posting here as I do not look at the other 2 threads now, to much bickering for me, nice calm and friendly here
Dave
5