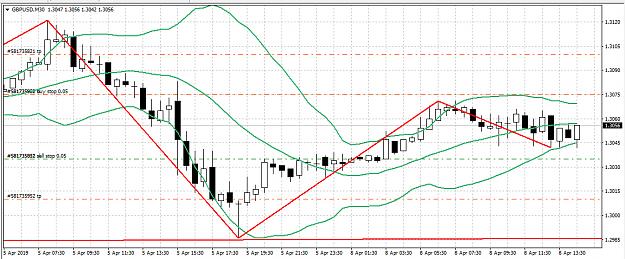
Cable
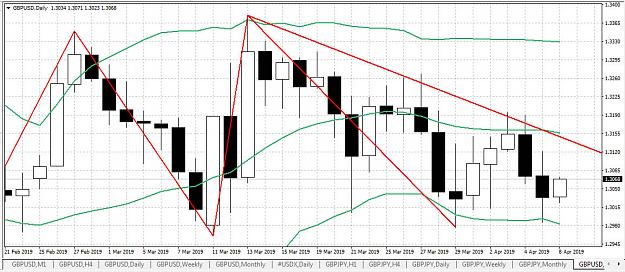
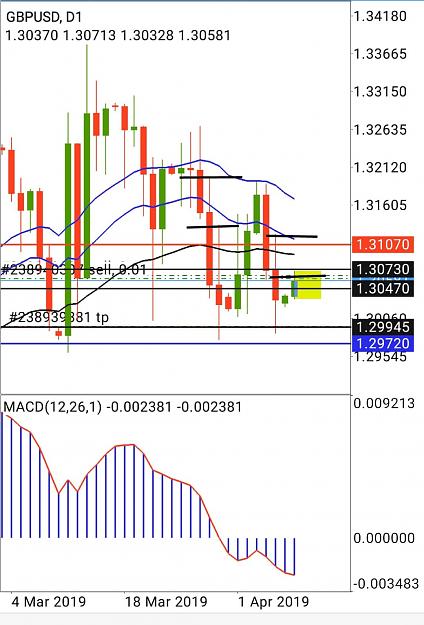
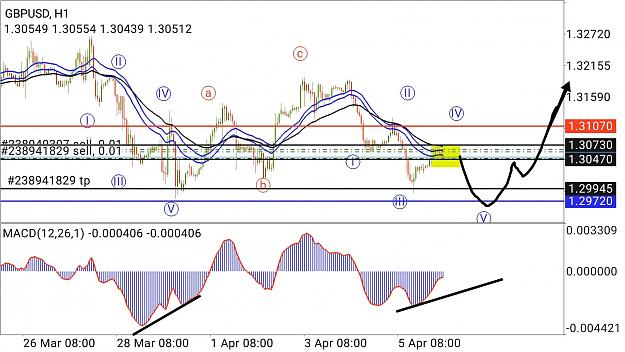
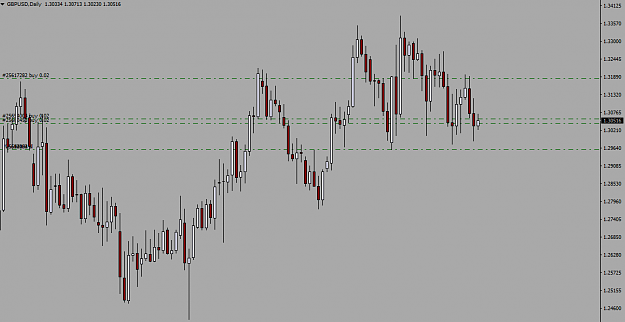
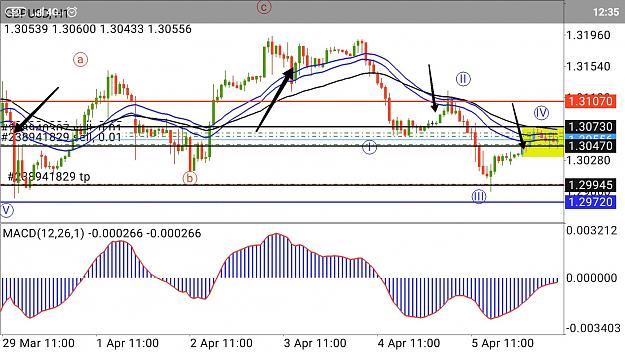
Generally on daily timeframes, if draw a trend line along the highest price value, it shows that
today's price probably goes to up at 1.3160 or meet the double top level at 1.3190. Another side,
the Bollinger bands(mid. line) also meet the trend line. So, it is considered that the price
most probably
goes to the 1.3160/1.3190.
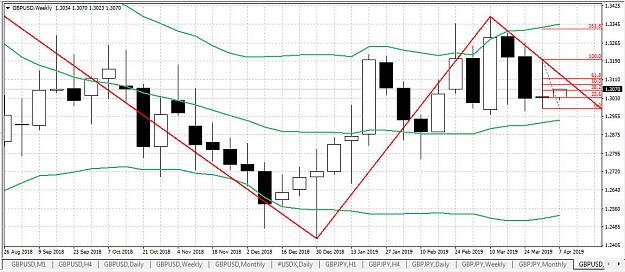
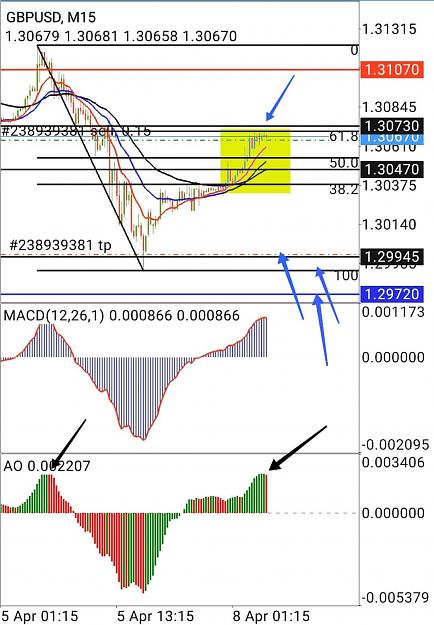
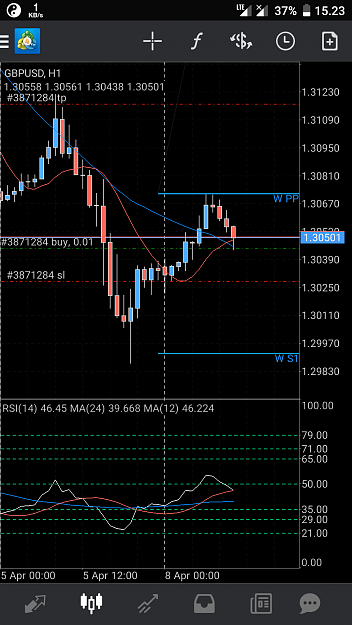
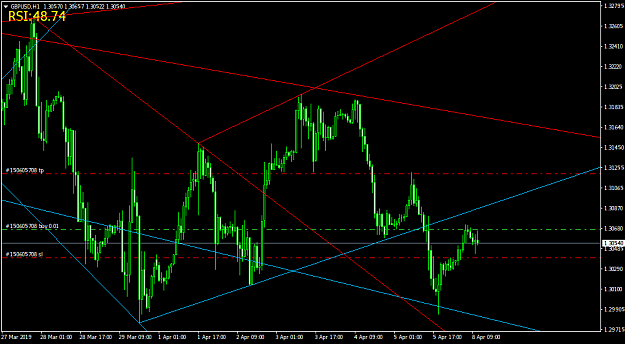
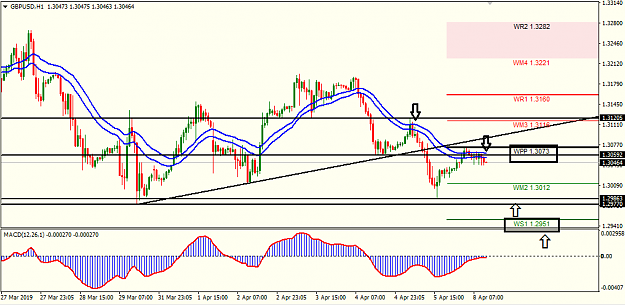
On weekly timeframes, if draw a trend line along the highest peak, it shows that today's price probably
goes to 1.3120. And if draw Fibonacci on the previous weekly candle, it shows that, if the price retrace 61.8
per cent of the previous weekly candle so the price has to go on towards 1.3110/1.3120. Another side 1.3121
has a resistance level. So, it is considered that the price most probably goes to 1.3110/1.3120. If the
price breaks the resistance level(1.3120), then the price probably goes to 1.3160/1.3190.