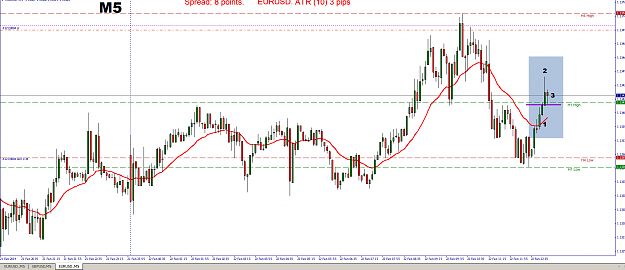
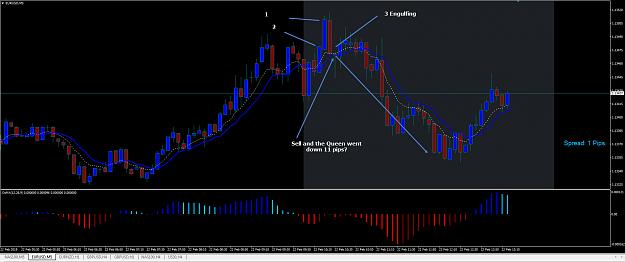
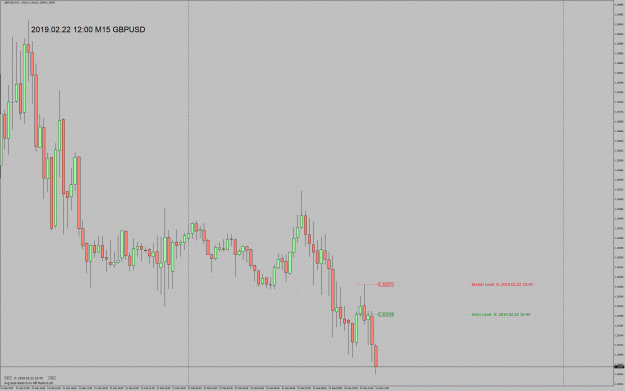
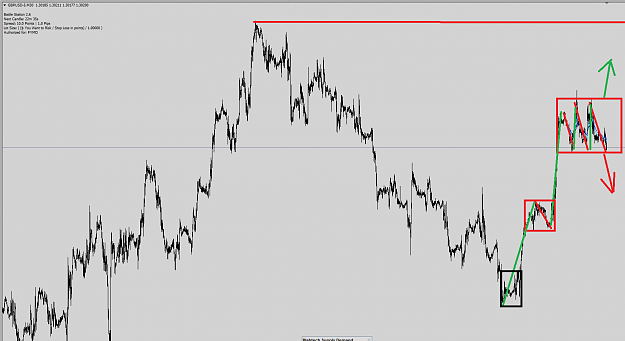
Disliked{quote} Hi Fymdglv, Could you kindly help me understand why it is a downtrend at the area of big arrow. I am looking at it like the below chart [attached the same GBPUSD-30M]. {image} Let me know where i could be wrong. ThanksIgnored
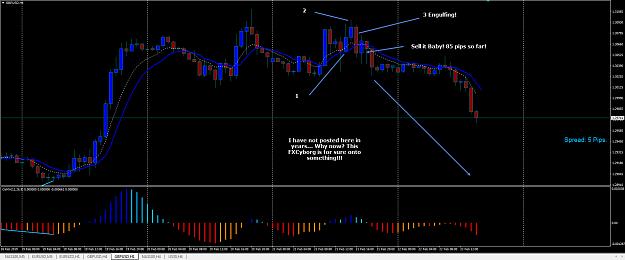
And for fun, just zoom out to a higher time frame (for example Daily), you'd see that entire ranging market within the top box I drew is three daily candles. And if you look at the High and Low of those 3 daily candles in relationship to each other, you'd get a good feel for where in that uptrend move you are. (looking at different time frames starting with a higher time frame and going down to a lower time frame to get a feel for what the price is doing is called a 'top down approach" which FXC alluded to in his posting today that he will be going over with us). And for fun, also look at the Daily TF and compare that to the same Elliot Wave Theory which FXC discussed (now on page 1). It will all slowly fall into place. We are super lucky to have someone as experienced like FXC offering all his wisdom with everyone here with no expectations in return!
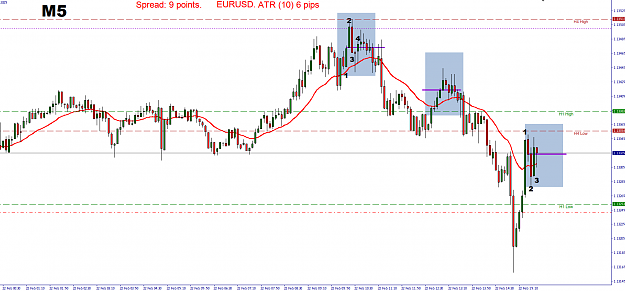
Attached Image (click to enlarge)
5