not sure if you understand FXCyborg's method for entries but based on your own chart the only valid trade per his posts at the beginning of this thread is at the following:
Attached Image (click to enlarge)
i would suggest reading over his posts if you truly wish to understand and apply his method...
{quote} not sure if you understand FXCyborg's method for entries but based on your own chart the only valid trade per his posts at the beginning of this thread is at the following: {image} i would suggest reading over his posts if you truly wish to understand and apply his method...
Ignored
I trade my own strategy. I have been trading for 10 years forex equal learning and becoming profitable in the past 5 years. For the past 5 years I have been trading forex full time.
{quote} I trade my own strategy. I have been trading for 10 years. The 5 years full time forex trading.
Ignored
congrats to you...perhaps you should start your own thread describing your own methodology rather than apply it to this thread and confuse others trying to learn from FXCyborg...just a thought
Is this right?
1. Uptrend, Look for buys
2. Accumulation
3. the setup
4. buy limit, set sl (1 pip from breach line) and tp
I notice after backtesting, that it's best to look for setup when the market is closing, since most of the time it's ranging/accumulating and trade it on the open the next day.
{quote} congrats to you...perhaps you should start your own thread describing your own methodology rather than apply it to this thread and confuse others trying to learn from FXCyborg...just a thought
Ignored
You're right, i will try to look for engulfing patterns as best as I can according to this thread rule. I will not open my own thread i don't have time for that and im just not interested in running my own thread. But thanks for the advice. Trade safe.
{quote} Show me the set up on your chart as per this thread?
Ignored
In his 2nd post's H1 chart, if you manually combine 2 H1 candles into one, it may be a valid H2 setup (3rd bar only engulfs 2nd bar, though first 2 bull bars do not have the same but maybe(?) close enough body size)
{quote} In his 2nd post's H1 chart, if you manually combine 2 H1 candles into one, it will be a valid H2 setup https://www.forexfactory.com/attachment.php?attachmentid=3216710&d=1550106541
Ignored
Of course. But the way it looks, this one will fail and i will have a loss but it's a small lot so it is according to my risk management. But it may go down still waiting.
{quote} I am not a follower and I do not trade anyone's strategy but mine. I only shared that engulfing bearish pattern because that is what thread is requiring here. But I have my own strategy and not looking to learn other people strategies. I have my setups and they generate good income every month. I will not show you any setups as I am not an educator and you are definitely not a student. What I share here which is going to be very rare, that is as far as it goes. Trade safe.
Ignored
Bearish Engulfing? hahaha, i doubt very much you trade full time, stop trolling and start your own thread.
{quote} Bearish Engulfing? hahaha, i doubt very much you trade full time, stop trolling and start your own thread.
Ignored
Yes bearish engulfing candlestick chart pattern. Have you heard of that rookie? I don't care what you doubt or not, im not a troll you rookie, i have been on FF for years. Stop stretching your nonsense. One more stupid comment and you're going on block list. Stop trolling you rookie and start sharing charts and ideas rookie.
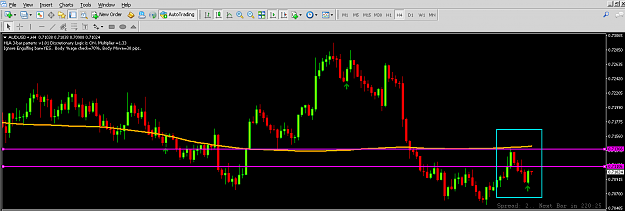
What you guys think here? I see two setups one after the other on the A/U 4h. Trend is down on 4h and daily as far as I can tell. How would you guys trade this? Also second one isnt as pretty as the first, but just curious to see what the forum thinks. Area .70507 seems like a support though. Maybe just leave it alone? Thanks!
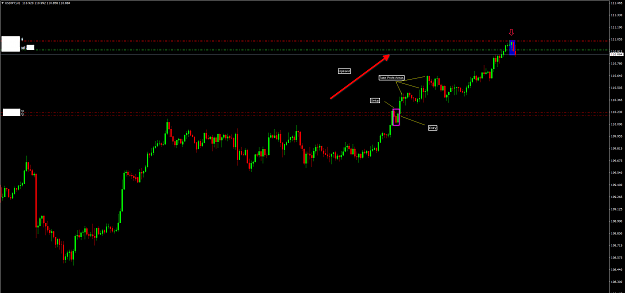
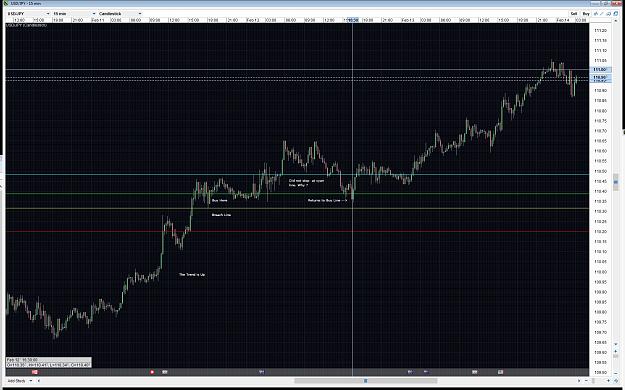
FXCyborg you said we shouldn't do partial TP closes because we should be able to read the price action and know where price will go. This looks like the USDJPY tp, 12-27-2018, 8 hr tf, 00:00, 111.367 Hi. But it is so far away in time from the recent high 2-12-2019, 15 min tf, 2:45 Hi 110.542. And 82.5 pips away in price. Can you explain further how to read price action and know where the price will go? See charts which have been labeled as you requested. Also FXCyborg what software do you use to draw the comments and cool graphics on your charts?....
Ignored
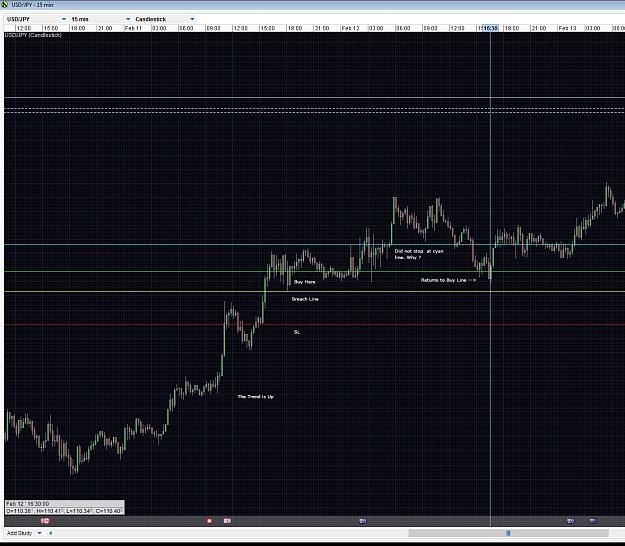
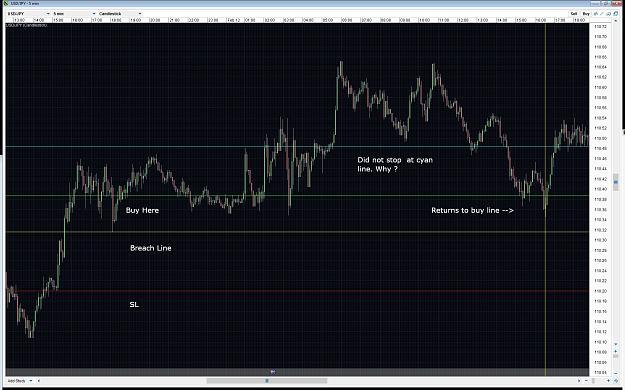
FXCyborg you can see in my previous post I believe I correctly identified and labeled a USDJPY buy set up according to your rules. Price rose made two tops and then dipped and touched the buy line again. But did not reach the sl. But has continued rising. Just amazing.
Reading the pa I thought that price would stop at the cyan line and then continue rising. Instead it went below it back down to the buy line.
Shouldn't the accumulation area at the cyan line been enough to have stopped USDJPY from falling all the way back to the buy line?
Any comments are greatly appreciated. And thanks again FXCyborg for sharing your knowledge.
See charts.
BTW I watched the DOM video you recommended. It was excellent. Thanks.
Here is a EURUSD Sell set up from today off of the M15 chart. {image}
Ignored
I got that one too. It was very profitable. I don’t normally look at 15 minute charts mostly 4 hr 1 hr and 30 mins. I couldn’t see any good setups so looked at 15 mins. I will definitely be checking these from now on.
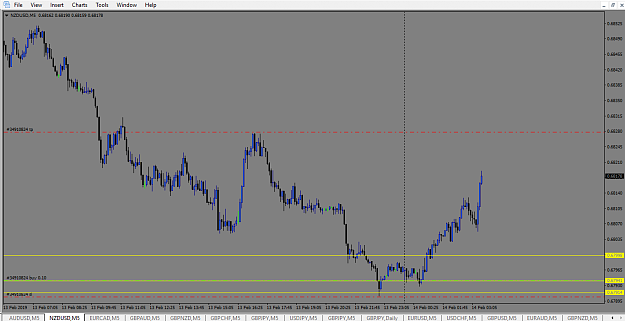
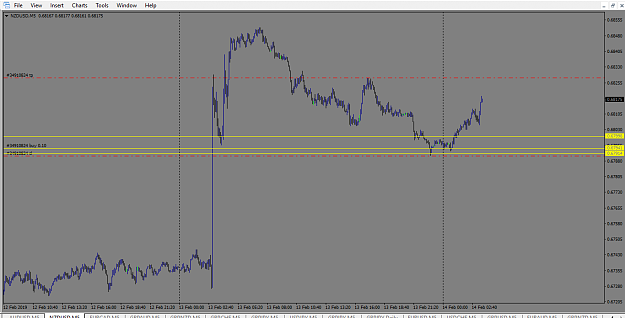
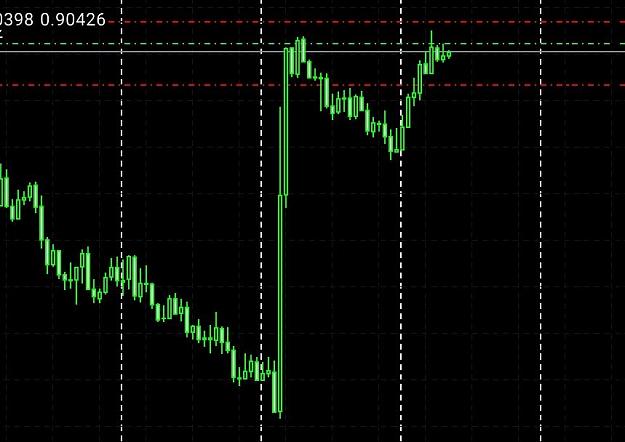
Took a short opportunity on USD/CAD first image is 5 minute chart of reason for entry, second image is reaction. {image} {image}
Ignored
Are we suppose to guess where your 3 bar set up is, holy cow man have you not been following this thread, obviously not. Post proper charts showing your set up, SL, and TP levels, otherwise you are wasting everyone's time here.
Hey guys, What you guys think here? I see two setups one after the other on the A/U 4h. Trend is down on 4h and daily as far as I can tell. How would you guys trade this? Also second one isnt as pretty as the first, but just curious to see what the forum thinks. Area .70507 seems like a support though. Maybe just leave it alone? Thanks! {image}
Ignored
A bit risky buying in a downtrend. I always get better returns looking for setups within the trend. Even if it takes a while it is worth the end result
Hello good morning boys. Waiting for eurcad h1 to sell in revisit opportunity.{image}
Ignored
I don't see your sell setup.
Don't see any 2 consecutive similarly sized bullish bars followed by an engulfing bar that engulfs only the adjacent bar.
Just me?
{quote} I don't see your sell setup. Don't see any 2 consecutive similarly sized bullish bars followed by an engulfing bar that engulfs only the adjacent bar. Just me?
Ignored
Excuse me it was nzdcad. I corrected. It hasn't confirmed pattern yet but i'm waiting for.