Took this earlier and its working out so far {image}
Ignored
Third bar doesn't engluf the second, or even close below which makes the setup invalid. Plus you didn't wait for price to retrace back to the entry zone.
|
Joined Feb 2019
|
Status: Junior Member
|7 Posts
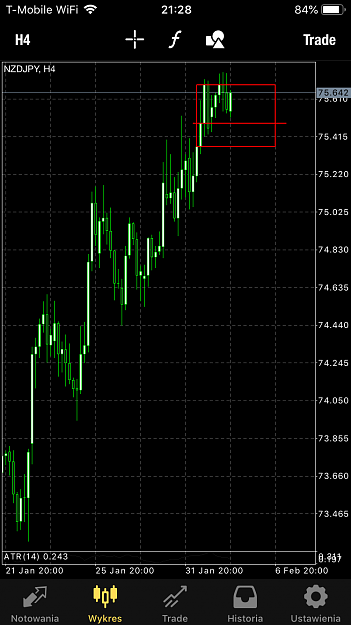
[quote = YoungET; 11962721] {quote} 1. Sie haben beide horizontalen Linien an der falschen Stelle platziert. Es sollte sich beim Schließen / Öffnen der ersten beiden Kerzen und am höchsten der drei Kerzen befinden. 2. Sie warten darauf, dass der Preis die nächstgelegene Linie erneut anzeigt. Sie haben lediglich das Schließmuster eingegeben. 3. Sie setzen die Anzahl der SL X-Pips OBEN / UNTEN über die am weitesten entfernte Linie, je nach dem Zeitrahmen, in dem sich das Setup befindet. Angst, Sie haben das Setup noch nicht fertig [/ quote]
I do not understand to 1. I have searched for a starting zone see left box and according to the rules set the lines to 2. wait until the price tests the zone again, in the M5 has emerged in this region again such a 3-he to 3. StoppLos corresponds to my RMM
I can't see any accumulation area there... The bearish engulfing pattern looks valid to me. Maybe post a bigger picture next time and ditch the smartphone
For ENTRY: I think it's between the Close of the 1st Bear Bar and The Open of the 2nd Bear Bar. I would prefer to enter there, unless otherwise stated. I would be willing to enter on a retracement to that region (Blue Rectangle). Some trends can be really strong and we don't get the retracement, so we skip it and look for opportunities like this in other pairs.
{quote} Third bar doesn't engluf the second, or even close below which makes the setup invalid. Plus you didn't wait for price to retrace back to the entry zone.
Ignored
Hi YoungET,
I think that I have this one right?
regards,
Peter
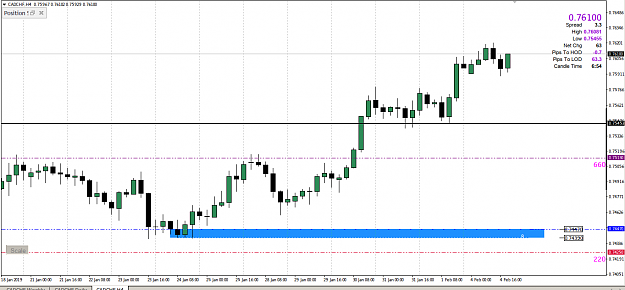
For ENTRY: I think it's between the Close of the 1st Bear Bar and The Open of the 2nd Bear Bar. I would prefer to enter there, unless otherwise stated. I would be willing to enter on a retracement to that region (Blue Rectangle). Some trends can be really strong and we don't get the retracement, so we skip it and look for opportunities like this in other pairs. Just my 2cents {image}
Ignored
Would say these two bear candles engulfed are very small in size.
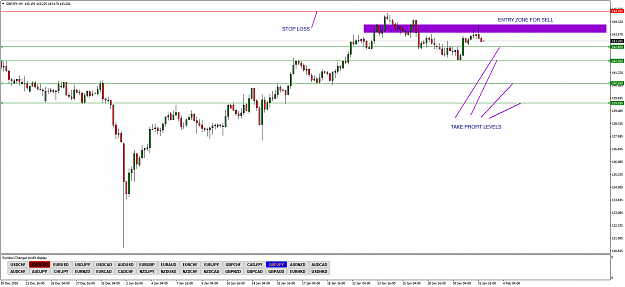
Hello everyone, I trust you're all keeping well The Markets have sure been acting somewhat out of fashion... nonetheless I was able to secure a little over 10% today... I'm going to take a break and I will get back to the posts that I have not attended to yet. ATB {image}
Ignored
Nicely said , its simple effective and profitable. keep up the good work,
THANK YOU
{quote} @digiff Hi Thank you for your post. re: the first image, you will notice my other image has this position already noted re: 2nd image, yes you are correct, however I used a RBS as my TP. However, see the wicks just below the entry, when navigating to the 1 Min TF, this will be our Str-Low. re: 3rd image, yes, if you want to be laser focused and drill down to the Lower TF, you may of caught this. Many here would not have and I simply wanted to create an illustration that shows these areas quite easily to be identified by those...
Ignored
To elaborate on digiff's point (and something that has stuck me while reading as well), you mention the importance of freshness, and that a visit to an area weakens said area, because the unfilled orders are getting filled (this is how i was taught as well). So on some posts, you say a level isnt valid any longer, because the area has been tested/unfilled orders have been filled, but in other images, like image one of the quoted post, you show a second entry of an already tested entry. Indeed, in other images you posted, you seem to advocate entering the same set-up with multiple entries on subsequent touches, showing a payout at the TP multiplied by 4, representing increasing risk on each subsequent touch. Could you please explain why sometimes you advise to invalidate a level after its been tested, while others you suggest not only not only that the level is valid, but that you should double, triple, even quadruple risk by re-entering on subsequent touches?
Great thread, not trying to be a "P.I.T.A," as you say, just want to make sure i'm fully grasping the methodology before i attempt to execute. Thanks!
{quote} if you zoom out to a 1 hr chart, its in the same zone as previously
Ignored
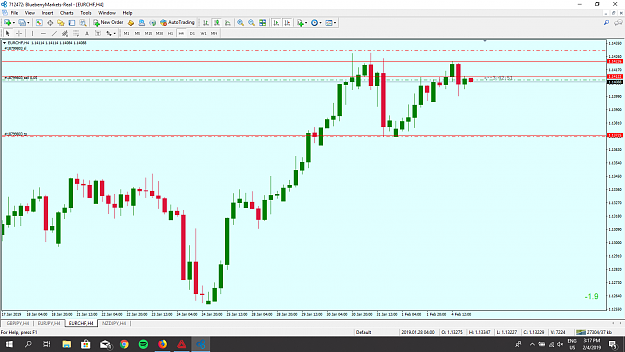
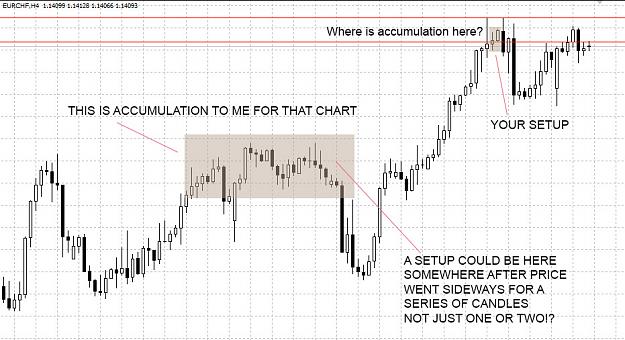
Sorry but can't see what you mean. To me accumulation refers to a period of up & down ranging behavior of price (sideways market) for at least some time (some series of candle swings, not just one or two candles) On you chart the left side is totally empty space with no past price action unless 1 H4 Candle (the one with the upper wick before your setup formation). No different if switching to H1 of the chart of zooming out on the H4 chart.
Maybe the following picture makes it more clear of what i mean with accumulation. Would be also interested in hearing the author about that once again, it seems to be very "hypothetical" what or what not is a valid accumulation area. I tried to google that but it never says how much bars/candles for a chart needs to move sideways that you want to trade. Is there any clear answer to this or can it be anything and everything depending on what the trader wants or wants not to see (so all relative..)
{quote} Sorry but can't see what you mean. To me accumulation refers to a period of up & down ranging behavior of price (sideways market) for at least some time (some series of candle swings, not just one or two candles) On you chart the left side is totally empty space with no past price action unless 1 H4 Candle (the one with the upper wick before your setup formation). No different if switching to H1 of the chart of zooming out on the H4 chart. Maybe the following picture makes it more clear of what i mean with accumulation. Would be also interested...
Ignored
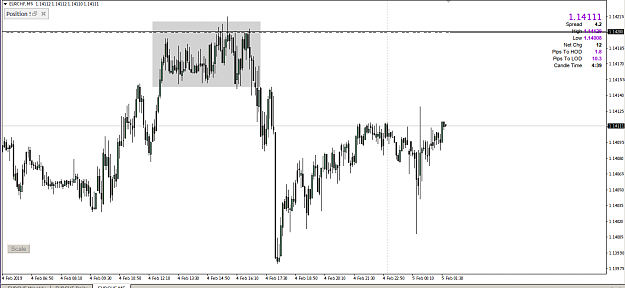
I think that depends on what timeframe you are viewing. That's a h4...5mins is showing an area where price has accumulated orders. It looks like a valid setup to me.