Things to keep in mind Froggy:
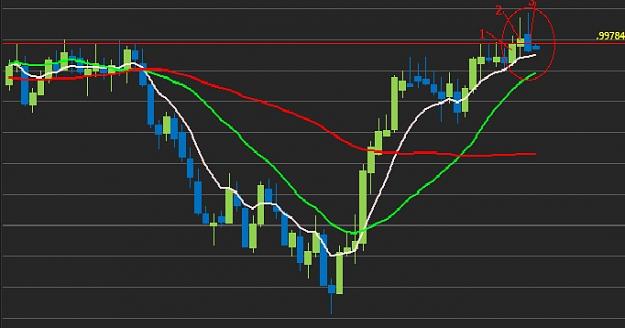
1. The SwingPivot, by itself is more reliable on a higher timeframe...h4 uowards
2. Can be tested up to the Bar #3s high
3. Yields better results when it occurs at a Best Level or Fib 50%
4. It's not a 100% win system.
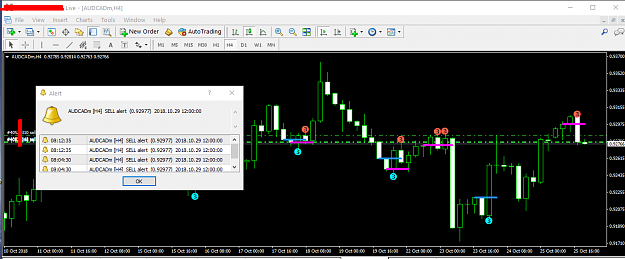
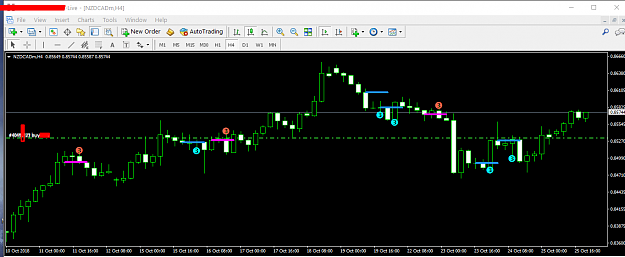
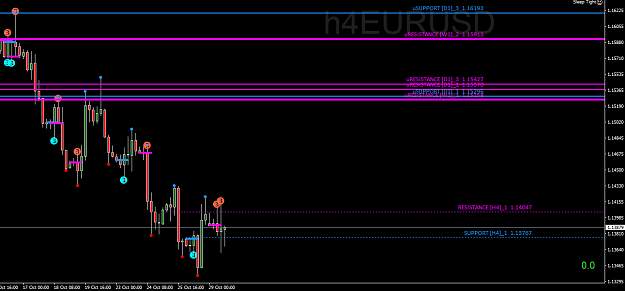
i was observing the rule's for swing...
my interest was to watch but when i see some retrace i took some position sell...
i'm curious on best buy/sell and history buy/sell how they are responding...
Attached Image (click to enlarge)
"Do not trade the trend, Trade on what you see and belief"
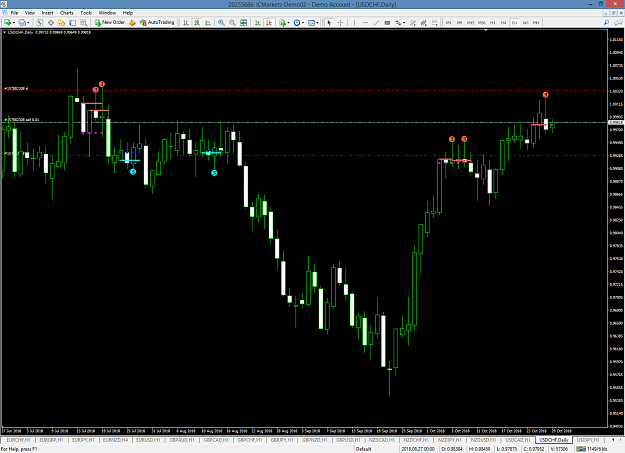
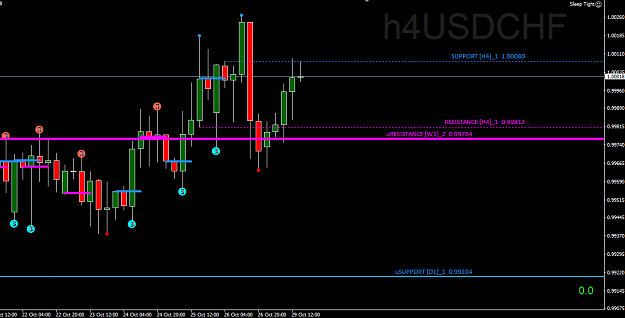
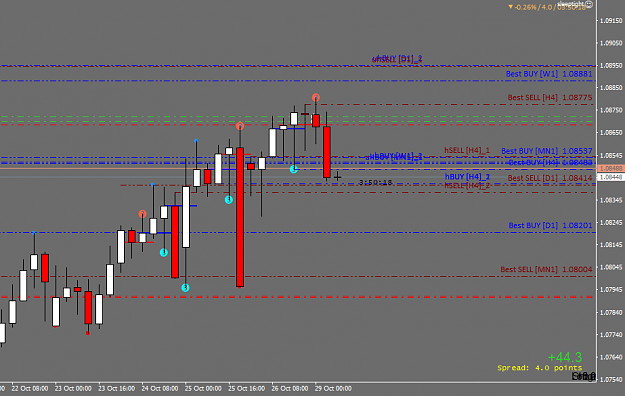
{quote} Hahaha... Yes I have a way of finding my own "PIVOT" levels. Since PIVOT suggests turning point. I go to the Weekly chart and take the Lowest Bearish Bar HIGH of each Swing Low as the Best SELL Levels for the Week and the Highest Bullish Bar LOW as the Best BUY Levels. I also do this on the Daily and Monthly and this gives me a pretty strong idea of the S/R Levels to trade. Hope this explains it. So for example UC just hit the daily SHORT level and sold off and closed strong below a WEEKLY BUY level...meaning likely strong bearish movement...