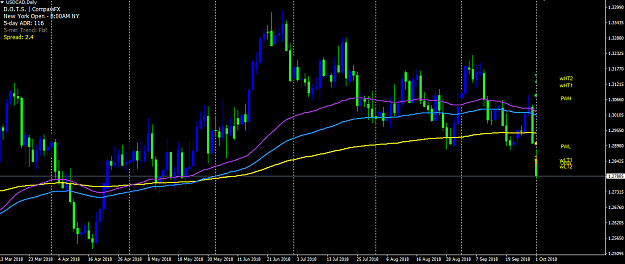
Disliked{quote} I only take my levels of importance from daily chart H/L ...........have a look at those levels in this chart............you need to go back to understand how those levels were picked carefully.......... {image}Ignored
Would you be so kind and explain in more detail your chart with the levels from daily. A couple of questions immediately come to mind.
1) Do you start to draw a line with wicks or candlebar's close/open?
2) What's the minimum of candlebars a line has to cross in order to exist? Where should a line cross those candlebars (wicks, close/open)?
3) The lines are of different color and width. Can you explain how you list them? The fattest line in the middle is the one that turned S into R for a major move, right?
Anything else you can add would be helpful.
Buy low, sell high.