Since we finally passed pervious highs from last week, I moved my SL to BA (2807). Fingers crossed for new highs. Lets see if we can pass 2880.
Ignored
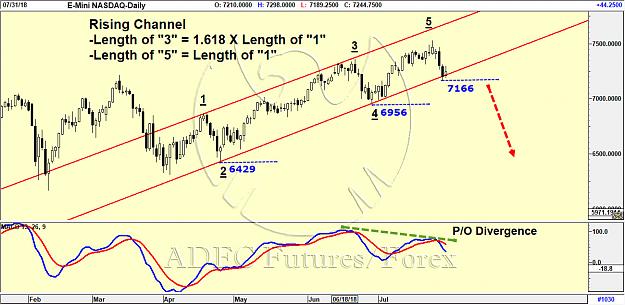
Good luck shebalik once again we seem to have a sell signal but once again we push up, I think we will get the new all time high soon, Fibonacci timing indicates Mid August for a turn, for me if we clear 2874 we will get yet another cap at 2892 but for how long ?
Target 2863 reached still needs to clear 2874 currently testing 2850 area. I've got 2845 as good support but we could see a trend change if we go below this level imo.
Indicators still a bit o/b volume positive for now
Mid August for a turn according to the timing Guru's
Not much interest to stocks I think? A good indicator to hold longs?
Also I find very positive the latest price action. Regardless of the latest drama and chaos about Turkey and strong global dollar rally, S&P still holding around 2830.
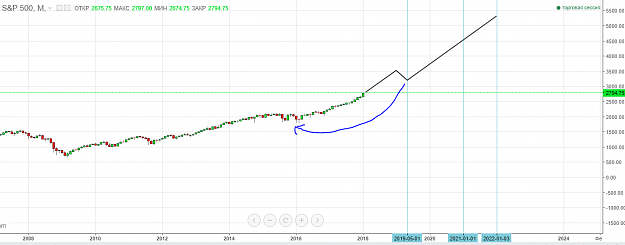
Honestly i cant explain, just because its a part of my competitive advantage. Lets just have a look how it goes. In fact im already wrong, cause i didnt expect to reach 2700 so quick. Thats what i expect, look at the picture. The digits like 5000 or 6000 doesn't matter, i have no idea what the price of index will be at that time. The factor of time tells that deep correction possible in the middle of 2019 roughly 2-3 months after or before, lets say may or june 19. Than up trend till the end of 2021. {image}
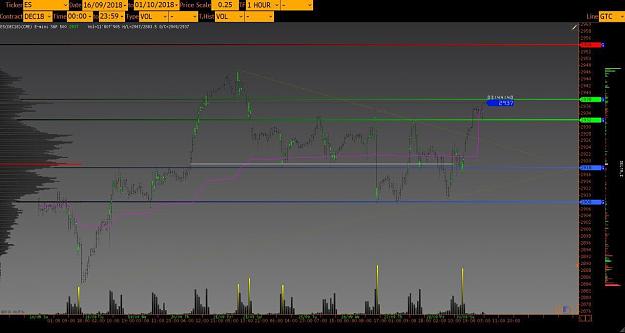
During the last week the instrument was traded in corrective consolidation. At the moment, you see signs of the end of this trend (breakdown resistance of the volumetric auction of sellers 2938 - 2932) and continued growth with the goal of 2954! It is worth noting that the key support is in the volumetric zone 2918 - 2908.
Bond yields heading higher means most likely stocks continuing to head lower.
Ignored
Bond yields may be cautiously heading higher as the Feds tweak interest rates to the upside to satisfy their mandate to control inflation. But make no mistake this economy is on fire (no matter how much you hate Trump) and stocks are likely to continue higher given Trump's economy. Trump's deregulation, lower tax and yes even his trade policies continue to stoke the fires of capitalism which is likely to lead to further increases in stock prices. Unless the economy shows signs of slowing which right now it is not by any stretch of the imagination bond yields will do their best to increase but yields are still somewhat low and at this time not really attracting investors. Inflation may lead to increasing bond yields but erodes NAV. A potentially inflationary scenario gives pause to long term bond investors and favors short term bond (short duration) investors fearful of increasing interest rates. Stocks are going up for now. Buy the dips and buy only high grade bonds with short duration.
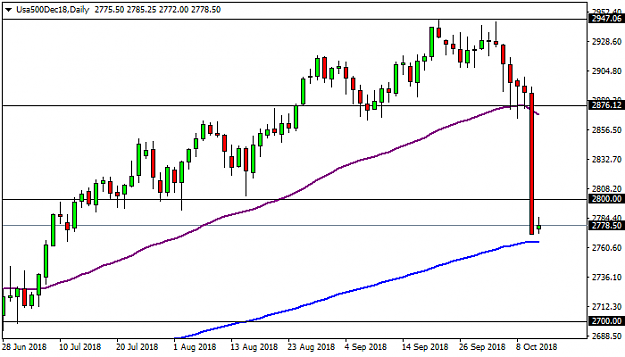
A bloodbath on the S&P 500. The S&P 500 plummets during today’s session with the US bond yields on the rise while risk aversion hits the markets. On the daily chart of the S&P 500 we can see that index drops below the 55 day EMA (purple line) at the 2876 level and breaks below the 2800 level to hit the 200 day EMA (blue line) zone, around the 2760 level. Right now the index is at the 2778 level and it may try to correct to the upside after the strong drop, but the 2800 level may act as resistance. To the downside, the 200 day EMA may act as support.
A bloodbath on the S&P 500. The S&P 500 plummets during today’s session with the US bond yields on the rise while risk aversion hits the markets. On the daily chart of the S&P 500 we can see that index drops below the 55 day EMA (purple line) at the 2876 level and breaks below the 2800 level to hit the 200 day EMA (blue line) zone, around the 2760 level. Right now the index is at the 2778 level and it may try to correct to the upside after the strong drop, but the 2800 level may act as resistance. To the downside, the 200 day EMA may act as support....
Ignored
I agree with you. Even try to correct could be by few hours. I hope the index at 2550. what´s your opinion.
Joined Mar 2006
|
Status: Trade the reaction not the news!
|10,252 Posts
Anyone who BTF'gD can expect to lose more before the bottom eventually hits.
Home building is tanking while inflation is rising. Not a good recipe for growth. And that massive tax cut is still helping the only ones it really helped, the 0.01 percenters.