{quote} atm higher on the unclosed month and below the unclosed q2... lower on the closed day and week.. till enough time Sunday to touch 1557 and 1682 or neither..
Ignored
wow.. first time heard this song in US... a very good memory for me while I was in college in China...
I'm back!!....for a minute anyway....lol I'm starting to sound like a broken record, but it's still Double S - Double D (Same Sequence - Different Day) since early August.... Be aware that a 155.9 bull proj. has been hit (1.1803x - 1.1810x) and the norm/LM for this bull corrective sequence is 1.1464/1.14447, and I show a 225 bear into that level... It should be noted that this is a correction in a bear sequence and the ultimate target is 1.10267 norm/1.09457 LM as shown on the chart. Good luck...C-YA! {image}
{quote} I have 1557x as the halfback mid of the entire move up, but more importantly, as the 155.9 bounce level of the current short term bear proj. It can, but does not have to, bounce back to 1732x from there. 1516x? --- pretty sure that is dead and gone...lol Either halfback at 1557x, or 1444x, the LM of the sequence that has been working perfectly for the last couple of months, will likely send it on towards 1.125Xx....(Should be 1.205Xx) Note the areas and levels marked in blue on the chart...........This is not something...
Ignored
Void 1.2054....
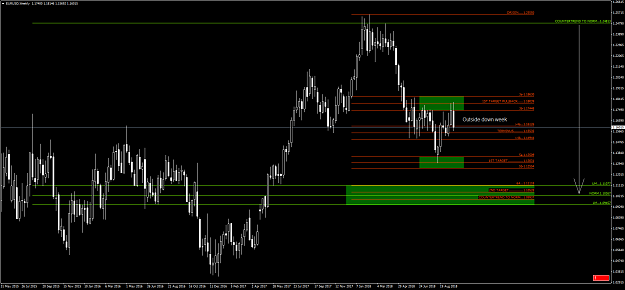
This has been an H4 corrective sequence on the road to 1.10267/1.09457, and, at this point, I think it has completed. This was an outside down week and now it's likely that no further upside beyond possibly 1732/41 norm/UM is going to occur before 1.1026/1.0945. The logic on the retracement after 1st target is the same on this weekly chart as it was on the H4 corrective sequence chart mentioned in the quoted post above.
Here's a chart showing the bigger view, which I momentarily lost sight of.
{quote} {quote} Void 1.2054.... This has been an H4 corrective sequence on the road to 1.10267/1.09457, and, at this point, I think it has completed. This was an outside down week and now it's likely that no further upside beyond possibly 1732/41 norm/UM is going to occur before 1.1026/1.0945. The logic on the retracement after 1st target is the same on this weekly chart as it was on the H4 corrective sequence chart mentioned in the quoted post above. Here's a chart showing the bigger view, which I momentarily lost sight of. {image}
Ignored
lets see where q3 closes.. summer range may be ending. last years close was supper bullish.. several year closes higher than previous. last years close was above the extended wicks. I would like to see where q3 closes.
those who can, do. those who cant, talk about those who can
{quote} lets see where q3 closes.. summer range may be ending. last years close was supper bullish.. several year closes higher than previous. last years close was above the extended wicks. I would like to see where q3 closes.
Ignored
Oh, I absolutely agree. Now, I don't mean to convey the message that I think the EUR is going to sink down to parity or anything like that....lol
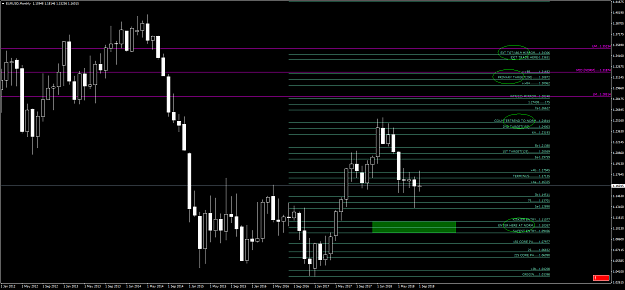
This pullback to 10267/09456 is the norm, as I have it, for a run to 1.3087x/1.3430x. The larger 10 year norm/UM at 1.3187x/1.3523x is also shown on the chart.
The weekly chart above shows the bear proj. into these levels.
Anyway, the closes will show the way.
Here's a chart that shows an even bigger picture (monthly chart) of the sequence I've been charting for the last 1-1/2 years...........
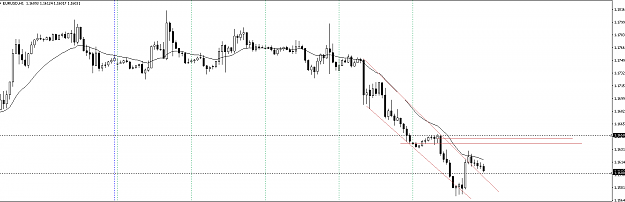
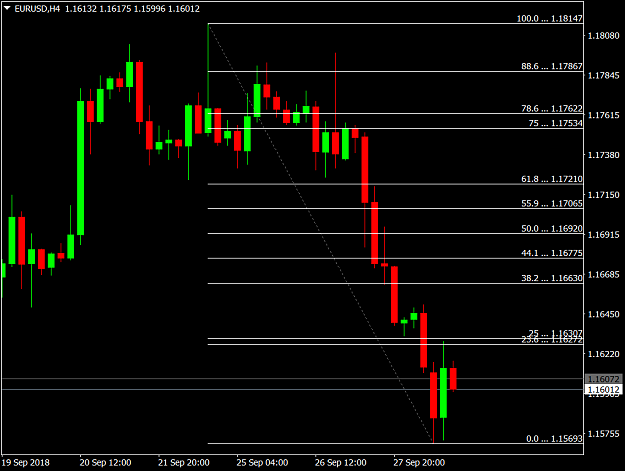
i took another shot. closest support at 3/4 level. targeting 1721 this time. edit: should be 1/4 i think. {image}
Ignored
rejection from 23.6 fib can mean continuation.
the day dit not close high enough to call it a spike.
but am still bullish till 1917 / 1927 and then 1.2 .
Here it is ... the Monday levels already displayed for default input parameter days_shift equal to 0 ... it works also in strategy tester as an attached indicator in visual mode ... by setting days_shift equal to a numerical value it can be displayed levels for a preview day back in time shifted with the numerical value ...
{quote} Here it is ... the Monday levels already displayed for default input parameter days_shift equal to 0 ... it works also in strategy tester as an attached indicator in visual mode ... by setting days_shift equal to a numerical value it can be displayed levels for a preview day back in time shifted with the numerical value ... {file}
Ignored
Got it
Thanks
A good trader follows his rules, but great trader knows when to break them
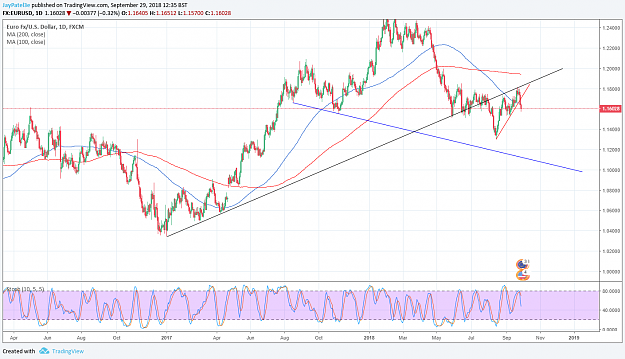
I think yesterday Euro bear was related more to the New Italian government not completely accepting the restriction of the European union bureaucrats but instead looking after the interest of its own people especially the most needed one.......anyway long story.... strange world we are living in....
What will happen next is not clear and nobody knows but I am sure the charlatans do.....
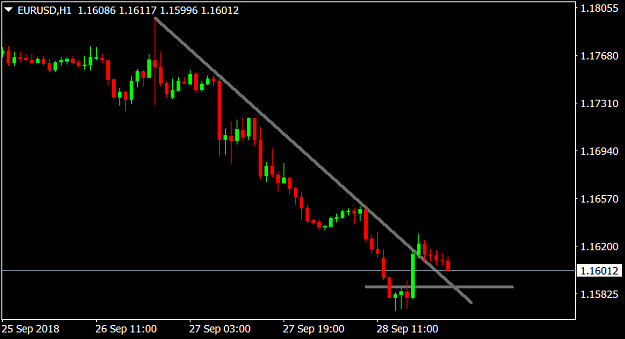
Prices where able to touch the ema as a PB and went back to 1.6, they also broke the steep down TL....
In my perception and trading style I will only reverse a strong trend if there is some broken TL....
Even after a TL broke prices tend to test the recent extreme, it can be a test, an overshot or an undershot before a possible reversal......
Or prices can end up into equilibrium/range/flag before anything else....in those cases fading its extremes are good trade possibility especially in the direction of the major force (top of the flag) but not only......Flags can often fail and their failure can also fail resuming its trend in the original direction and catching more traps traders and fuelling the move by the covering......
All this can be a bit confusing because each technicality can present various possibility otherwise we will be all very rich.......(and then nobody will need to trade).....the beauty lays on the fact of knowing that trading is confusing and it is up to each of us to create our own island to take advantage of this sea of beautifully uncertainty.....
Enough from me......some music to compensate my BS...balance is needed...
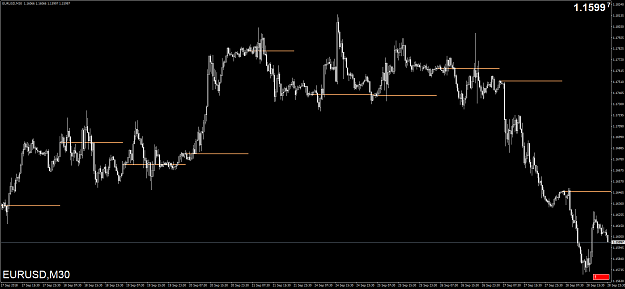
{quote} BTW, this template plots all the short term LC's if you want to try it.... Go to Hanover's thread to get the indicator.....(at the bottom of post #1) https://www.forexfactory.com/showthread.php?t=256848 And here is the template to use.... 2988098 This plots H6, H12, Day, and Week closes, and the London open... {file} Here's what it looks like... Red is Weekly (Friday) Green is Daily (Monday, Tuesday, Wednesday and Thursday) Tan is H12 Teal is H6 Magenta is the London open You can also track the NY roll if you want... Note 1: If...
Hi all, Once it's set up, how do you trade it? {quote}
Ignored
That's a good question! It's about where the current close is relative to previous closes: the highest or lowest close of the previous month, quarter, or the highest corrective high, lowest corrective low, etc.
I'm just learning the method by following Gator's posts and that is also what I suggest you do. Gator is the expert on the subject.
Regarding that template that I posted: I put all those different closes; H12, Daily, etc. on one template. I figured that anyone who was actually interested in learning this would discover for themselves pretty quickly that it is better to plot each time frame close on a chart by itself. It's easy enough to create a separate template for each TF using the master template. Then just switch between templates to compare the daily close, H12 close, etc.
It is aso set for a GMT plus 2 broker: If your broker uses other times, then you must change the time setting in the indicator.
Note also that there is some debate about just when the London day close is. This uses 11:30 A.M. New York time, which is what Gator uses for time frames under one month.
Hanover's indicator is limited in its ability to do all that I would like it to do: I can't get it to plot the price on the close line, nor will it correctly plot monthly, quarterly or yearly closes. It is limited to weekly closes or lower and it also must remain on the M30 time frame to plot correctly.
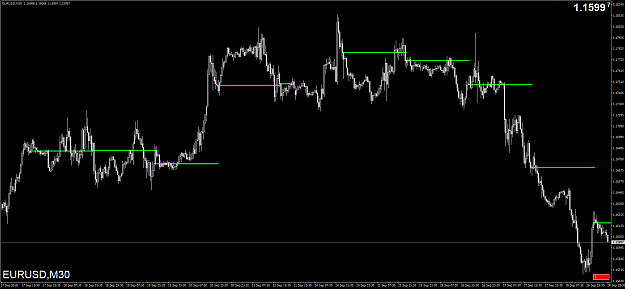
For example, here's the H12 and daily London close charts as I use them:
{quote} Here it is ... the Monday levels already displayed for default input parameter days_shift equal to 0 ... it works also in strategy tester as an attached indicator in visual mode ... by setting days_shift equal to a numerical value it can be displayed levels for a preview day back in time shifted with the numerical value ... {file}
Ignored
Hi imwim
Can you figure out the formula or algorithm to a calculator? This abbonacci guy had one which used to have some insanely accurate Levels... he disappeared and its probably all out of date right now. I can look for the calculator if you fancy having a look at it
{quote} new targets in bold, targets reached are striked: EU 1.219x and 1.135x UC 1.227x and 1.336x UJ 106.7x and 1.125x AN 1.080x GU 1.396x and 1.283x EJ 136.9x and 1.264x EC 1.577x and 1.391x EG 0.868x bitcoin1135x NU 0.652x
Ignored
new targets in bold, targets reached are striked:
EU 1.219x and 1.135x
UC 1.227x and 1.336x
UJ 106.7x
AN 1.080x
GU 1.396x and 1.283x
EJ 136.9x and 1.264x
EC 1.577x and 1.391x
EG 0.868x and 0.893x
bitcoin1135x
NU 0.652x
AU 0.723x
{quote} Here it is ... the Monday levels already displayed for default input parameter days_shift equal to 0 ... it works also in strategy tester as an attached indicator in visual mode ... by setting days_shift equal to a numerical value it can be displayed levels for a preview day back in time shifted with the numerical value ... {file}
{quote} new targets in bold, targets reached are striked: EU 1.219x and 1.135x UC 1.227x and 1.336x UJ 106.7x AN 1.080x GU 1.396x and 1.283x EJ 136.9x and 1.264x EC 1.577x and 1.391x EG 0.868x and 0.893x bitcoin1135x NU 0.652x AU 0.723x
{quote} Hi imwim Can you figure out the formula or algorithm to a calculator? This abbonacci guy had one which used to have some insanely accurate Levels... he disappeared and its probably all out of date right now. I can look for the calculator if you fancy having a look at it
Ignored
Just open the SR_levels.mq4 file in a Notepad and use the formula in Excel, using only Previous Daily Close, Previous Daily High and Low as input variables ...
{quote} Just open the SR_levels.mq4 file in a Notepad and use the formula in Excel, using only Previous Daily Close, Previous Daily High and Low as input variables ...
Ignored
no no i have something else thats a calculator... i will pm you