Hello all, I just want to understand what is the best time to trade Paradow, so you tell something about 9-10 pm to 4 am your trading time so for me is from NY open until LO open? Thank you
Ignored
If you can according to your local time zone, you want to create your plan for the Asia Session, and trade the Asia session. The Euro session is loaded with news. The new data is for 17:00 ET (New York time) each day.
Daily
ROMAR - support
EMA - support
Parabolic - support
Checklist:
Last MACD 0 Crossing - up
Last EMA Alert Arrow - up
Last DB Attachment - up at 131.669
Fibonacci - red
Notes: 4horsemen is in strong uptrend on Daily.
H4
ROMAR - support
EMA - support
Parabolic - support
Notes : SAR hit parabolic support on h4 chart. Parabolic trend is still holding market up.
H2
ROMAR - support
EMA - resistance
Parabolic - resistance
Checklist:
Last MACD 0 Crossing - down
Last EMA Alert Arrow - down
Last DB Attachment - down at 130.771.
Fibonacci - red
Notes: 4horsemen is down. DB attached with lightskyblue divergence at 130.771. Fibo 0 level is 131.669.
H1
ROMAR - support
EMA - resistance
Parabolic - resistance
Checklist:
Last MACD 0 Crossing - down
Last EMA Alert Arrow - down
Notes: Market hit romar support at 130.771. 4horsemen is down but romar is still support.
FİNAL NOTES:Shortly we are in uptrend on daily chart. SAR attached up and down on h2 chart so we are in consolidating uptrend with DB attachment at the bottom. For this scenario; when last DB attachment at the bottom in uptrend, next DB attachment will be at the top. So i will be long, but just want to wait for sydney session.
Trading plan 20/09/2018 Economic news : No red news Daily ROMAR - support EMA - support Parabolic - support Checklist: Last MACD 0 Crossing - up Last EMA Alert Arrow - up Last DB Attachment - up at 131.669 Fibonacci - red Notes: 4horsemen is in strong uptrend on Daily. H4 ROMAR - support EMA - support Parabolic - support Notes : SAR hit parabolic support on h4 chart. Parabolic trend is still holding market up. H2 ROMAR - support EMA - resistance Parabolic - resistance Checklist: Last MACD 0 Crossing - down Last EMA Alert Arrow - down Last DB Attachment...
Ignored
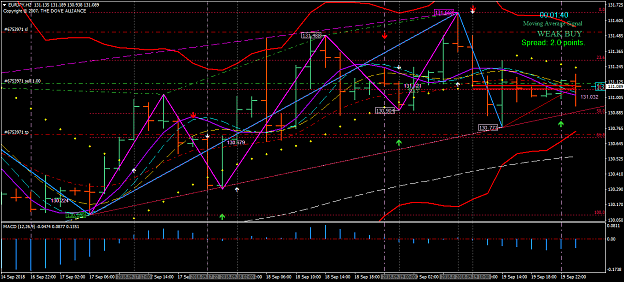
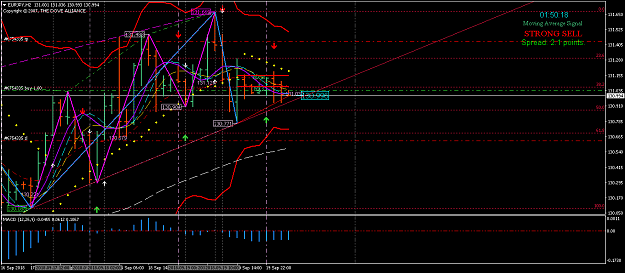
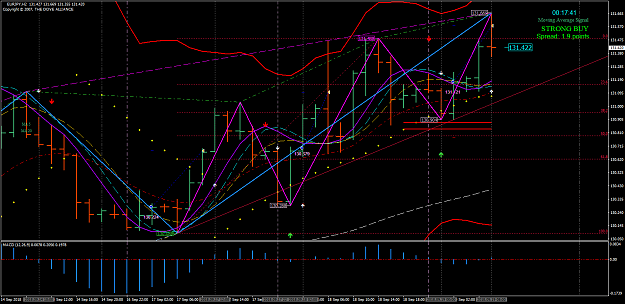
entered short at 131.114 because after opened daily candle i realized that parabolic and ema trend is still down on h2 chart and i have enough pips till fibo 61.8 level to be short.
Date: 20 September 2018 10.30 AM GMT+7
Market news:
22.15 Medium German Buba President Weidmann Speaks
Daily:
ROMAR - Support
EMA - Support
PSAR - Support
Check List:
Last MACD 0 crossing: Up
Last EMA Alert Arrow: Up
Last DB Attachment: Up 131.669
Last SAR Attachment: Up 131.669
Fibonacci: Red
Notes: 4 horsemen in Uptrend. Magenta Divergence attach at Top with DB/SAR. Daily in Uptrend.
2 HR:
OPEN PRICE – 131.03
ROMAR - Support
EMA - Resistance
PSAR - Resistance
Check List:
Last MACD 0 crossing: Down
Last EMA Alert Arrow: Down
Last DB Attachment: Bottom 130.771
Last SAR Attachment: Bottom 130.771
Fibonacci: red
Notes: H2 is in consolidation with EMA & PSAR holding Resistance. Whitr is at Purple and when it cross, PSAR is eliminated in consolidation.
1 HR:
ROMAR - Support
EMA - Resistance
PSAR - Eliminated
Check List:
Last MACD 0 crossing: Down
Last EMA Alert Arrow: Up
Fibonacci: Red
Notes: White and smooth are very tight crossing with purple. Market tested fibo 23.6 support.
Final Notes: Market is in consolidated uptrend. I will take LONG Entry off Support referencing from H1 in the next candle.
Date: 20 September 2018 10.30 AM GMT+7 Market news: 22.15 Medium German Buba President Weidmann Speaks Daily: ROMAR - Support EMA - Support PSAR - Support Check List: Last MACD 0 crossing: Up Last EMA Alert Arrow: Up Last DB Attachment: Up 131.669 Last SAR Attachment: Up 131.669 Fibonacci: Red Notes: 4 horsemen in Uptrend. Magenta Divergence attach at Top with DB/SAR. Daily in Uptrend. 2 HR: OPEN PRICE – 131.03 ROMAR - Support EMA - Resistance PSAR - Resistance Check List: Last MACD 0 crossing: Down Last EMA Alert Arrow: Down Last DB Attachment: Bottom 130.771 Last SAR Attachment: Bottom 130.771 Fibonacci: red Notes: H2 is in consolidation with EMA & PSAR holding Resistance. Whitr is at Purple and when it cross, PSAR is eliminated in consolidation. 1 HR: ROMAR - Support EMA - Resistance PSAR - Eliminated Check List: Last MACD 0 crossing: Down Last EMA Alert Arrow: Up Fibonacci: Red Notes: White and smooth are very tight crossing with purple. Market tested fibo 23.6 support. Final Notes: Market is in consolidated uptrend. I will take LONG Entry off Support referencing from H1 in the next candle.
Evaluation
TP hit. My entry was referencing to fibo 23.6 and ROMAR as support. Ideal entry actually was market touched ROMAR, but I prefer to place Buy position at the opening of candle instead of placing BUY LIMIT. It's because distance of fibo 23.6 to ROMAR is around 10 pips at that moment, so still out of reach to 40 SL.
{quote} Evaluation TP hit. My entry was referencing to fibo 23.6 and ROMAR as support. Ideal entry actually was market touched ROMAR, but I prefer to place Buy position at the opening of candle instead of placing BUY LIMIT. It's because distance of fibo 23.6 to ROMAR is around 10 pips at that moment, so still out of reach to 40 SL.
Ignored
Good use of H1 as a reference back into the uptrend. Great trade
{quote} entered short at 131.114 because after opened daily candle i realized that parabolic and ema trend is still down on h2 chart and i have enough pips till fibo 61.8 level to be short. {image}
Ignored
ROMAR is still up on all charts why take the risk of shorting
{quote} entered short at 131.114 because after opened daily candle i realized that parabolic and ema trend is still down on h2 chart and i have enough pips till fibo 61.8 level to be short. {image}
Ignored
Evaluations: Sl hit. I was confused because parabolic and ema was down on h2 chart but i understand that i needed to wait for right oppurtunity to be long.
{quote} Yes, it was risky trade. Next time i will be carefull.
Ignored
It's okay to make mistakes, and you're not the only one. Just try to always take the positive and negatives from it so you can grow as a trader and if the same situation comes again, you have experience with it.
Daily:
ROMAR – Support
EMA – Support
PSAR – Support
Check List:
Last MACD 0 crossing - up
Last EMA Alert Arrow - up
Last DB Attachment - up
Fibo down
Notes: Romar Support with EMA and Parabolic Support. Horsemen up. Last DB/ SAR up with Divergence. Fibo is Down. MACD up.
H4:
ROMAR – Support
EMA – Support
PSAR – Support
Check List:
Last DB Attachment - up
Fibo down
Notes: Romar Support with EMA and Parabolic Support. Horsemen up. Last DB/ SAR up with Divergence. Fibo is Down.
2 HR:
ROMAR – Support
EMA – Support
PSAR – Support
Check List:
Last MACD 0 crossing - up
Last EMA Alert Arrow - up
Last DB Attachment - up
Fibo down
Balance – 7 candles out
Notes: Romar Support with EMA and Parabolic Support. Horsemen all Support. Last DB/ SAR up with Divergence. Fibo down. MACD up. Market did hit the upper BB in the move up.
1 HR:
ROMAR – Support / Resistance
EMA – Support / Resistance
PSAR – Support / Resistance
Notes: Romar Support with EMA and Parabolic Support. Horsemen all Support. Fibo Down.
Market Condition: Uptrend
Final Notes: All charts are showing the Uptrend, but with Red Fibo’s. In the moment H2 is out of Balance so expecting a move to Purple. Looking for Long Trade.
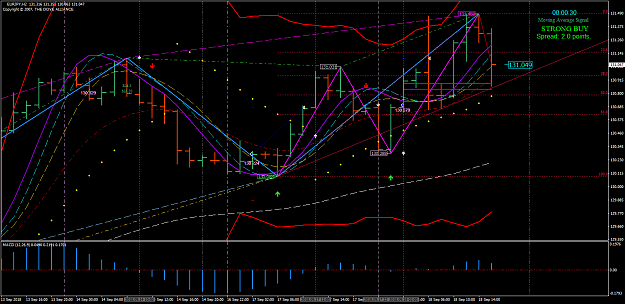
Entry: Long at 11pm Open. H2 opened with Purple and confluence H1 with Smooth.
Evaluation: TP hit. Good trade, into the Trend. Pulled the trigger at 11pm and went to bed.
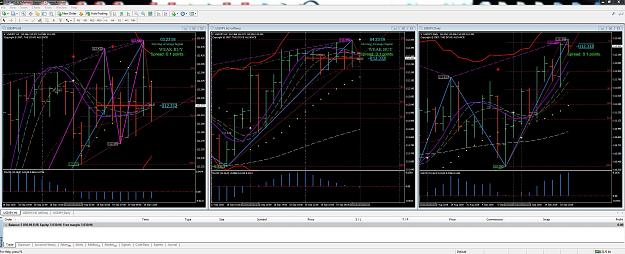
Here are my trades on this week... 4 win and 1 loss.
Monday and Tuesday:
Attached Image (click to enlarge)
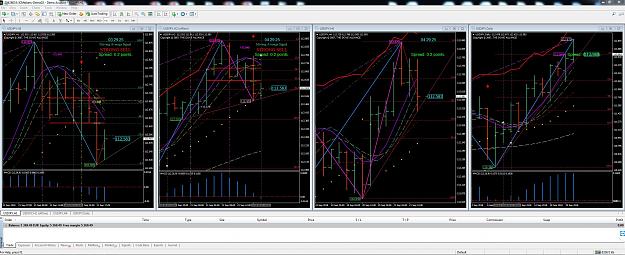
Wednesday:
Attached Image (click to enlarge)
On Thursday I took a loss. The entry was mistimed and with broken rules.
Friday (Today):
Attached Image (click to enlarge)
May be these are not perfect entries but I think they are good. I am showing these just to encourage those traders who already know all the rules but couldn't make it due to psychological problems.
Have a very good weekend everybody...
Regards,
Ronin
(Note: Please note that my MA lines are not correct.)
Nice Ronin! thank you for the pictures! I read over 80 pages of this trend but all this lines and rules is very difficult for me, I try to find an standard easy way for this system but very difficult! Ok Dove tell: it is simple but I still try to understand many things, every line do something and cross another one chenge everything....so first of all sorry for my poor english and I would like to ask a couple of things:
1. DB?
2. SAR are the yellow dots!?
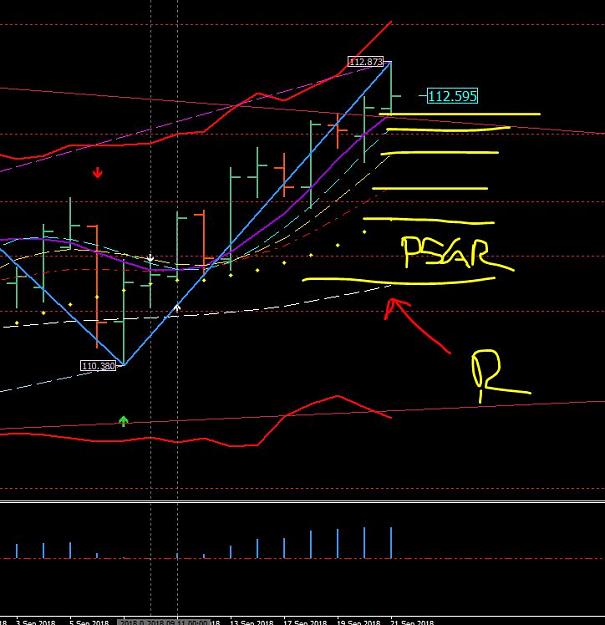
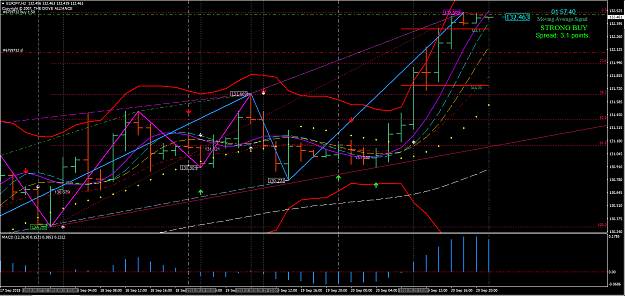
first pic is my chart on my pc in London on ICM broker demo
second
in a second picture the lines figure out a imaginary line following each candle so change this lines every time when move further?
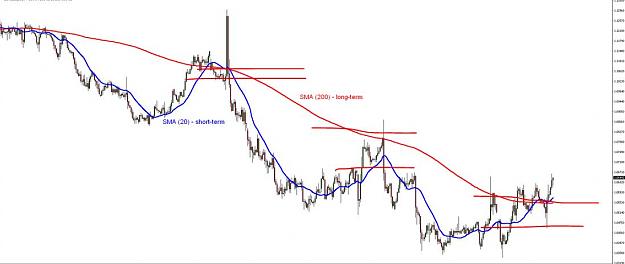
I miss or I do not find many explanation about MA5 and MA20 with the 2 red lines I know what they are but I try to find their role in the picture, I suppost they are similar like I put in the picture 3!?
Nice Ronin! thank you for the pictures! I read over 80 pages of this trend but all this lines and rules is very difficult for me, I try to find an standard easy way for this system but very difficult! Ok Dove tell: it is simple but I still try to understand many things, every line do something and cross another one chenge everything....so first of all sorry for my poor english and I would like to ask a couple of things: 1. DB? 2. SAR are the yellow dots!? first pic is my chart on my pc in London on ICM broker demo second in a second picture the...
Ignored
Your understanding does not prove that you read upto page 80. Please read again. Everything is in the thread. This system and this thread is complete. There is nothing to rediscover.
Please note: If you are looking for shortcut and if you do not have strong determination and enough time (at least 6 months) to invest then this system is not for you.
Nice Ronin! thank you for the pictures! I read over 80 pages of this trend but all this lines and rules is very difficult for me, I try to find an standard easy way for this system but very difficult! Ok Dove tell: it is simple but I still try to understand many things, every line do something and cross another one chenge everything....so first of all sorry for my poor english and I would like to ask a couple of things: 1. DB? 2. SAR are the yellow dots!? first pic is my chart on my pc in London on ICM broker demo second in a second picture the...
Ignored
It is very interesting that you subscribed to this thread on 10 Feb, 2016!!! You made several posts and you came back several times!!! And yet you are at page 0 !!! Definitely this system is not for you. You keep those subscriptions and prove to yourself that you have a single month profitable. If you do have a single month profitable then keep up with those and leave this system. So this Paradox is a No No for you.