botan. please then explain to me that why the overlay chart matches the recent new high or low made. how can we know that it is a true top or bottom? please instead of being rude, research and guide.
Forex is a wild wild beast. You cannot tame it. Just run wild with it.
It's not a top. It's a "potential" top, or a sell zone. You must use other elements to appreciate if this zone is going to effectively turn out to be a top or not.
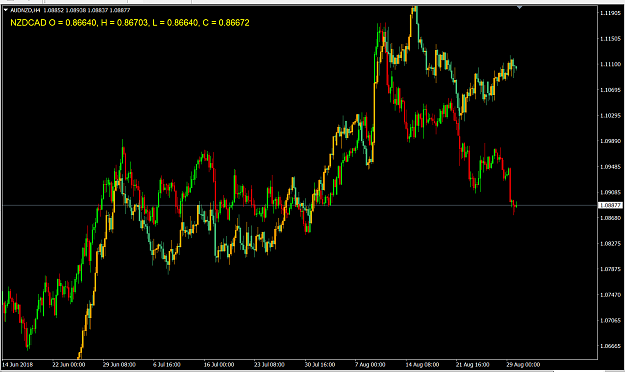
I have been following this pair since Monday. the euraud hit top yesterday but the price keeps going up and the top changing according to that. so it means there can be no tops as it changes continuously. earlier the top was at 1.595. now it is making a new top and the audchf just matches that. Neil I think the theory is all flawed. doesn't work. {image}
Ignored
wait...if you say that the top was 1.595, reading the chart i see the top is 1.60300 where you marked the same of july /august. but if you see also Daily chart the top is 1.6200 maybe i would advise you to put daily chart because it's more reliable instead 4h. Isn't? Another thing but...what fuck is it happening to GBP and CHF? No red news and the price spike!
botan. please then explain to me that why the overlay chart matches the recent new high or low made. how can we know that it is a true top or bottom? please instead of being rude, research and guide.
Ignored
Hi,
Read my post 1879 there i explained.
But no problem to do again.
The overlay is based on high and low of the two pairs over the period.
This can be the period on the chart, with period i mean the number of bars.
These are matched and we have the overlay chart.
If the next bars give for one of the pairs a higher high or a lower low then there will be a new match.
of the pairs based on the actual max and min values of the two pairs.
So a new high will give a new match which looks different.
This happened to EURAUD.
See post 1891, two charts with different periods and different looks.
BR
It is not important how often you fall down, but how often you get up again
{quote} Hi, Read my post 1879 there i explained. But no problem to do again. The overlay is based on high and low of the two pairs over the period. This can be the period on the chart, with the period I mean the number of bars. These are matched and we have the overlay chart. If the next bars give for one of the pairs a higher high or a lower low then there will be a new match. of the pairs based on the actual max and min values of the two pairs. So a new high will give a new match which looks different. This happened to EURAUD. See post-1891, two charts...
Ignored
so there is no clear way to find a true top/bottom. so, if we say we look at the price action to take our entry once the price reaches the alleged top/bottom, well look at GBPCAD. it is going down like anything for the past weeks. it had hit the bottom and there have been instances when the price went right back and then only to return way down.
It just took off... Hope you had a pending buy order... Hibra it will drop again... As you have it on weekly, the weekly trend is down :-) OK I'm off again now, just wanted to post that... Amazing what you can do wherever you are in the world. It's called technology. {image}[/quote]
so, where is the price now? making newly alleged bottoms.
Forex is a wild wild beast. You cannot tame it. Just run wild with it.
Hi Guys, Some remarks from my side. I see some discussion about overlay charts and correlation. The overlay charting is just a calculation between two pairs by matching the minimum and maximum of the two pairs over a certain period. This is just done by shifting the two pairs based on max/min values of the two pairs to each other and some resizing of bars/pips, needed for 5 and 3 digit pairs. If for one of the pairs in the bars to come the max/min value over the calculated period of one pair will change, than the shift will change and also the charting....
Ignored
Great analysis emonts, it´s possible we have your modified indi in order to do some charts tests please? Thanks
Now you know why I have stopped posting and left this place... Besides the psycho stalkers, no one listens....
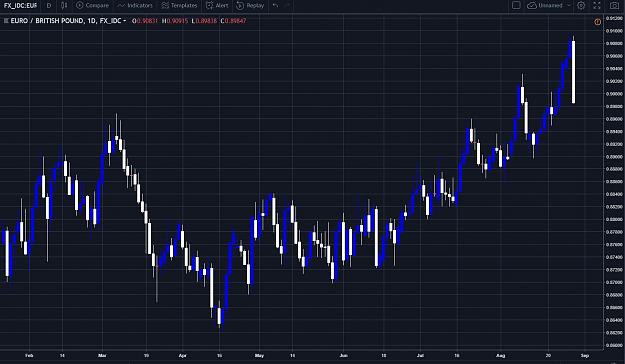
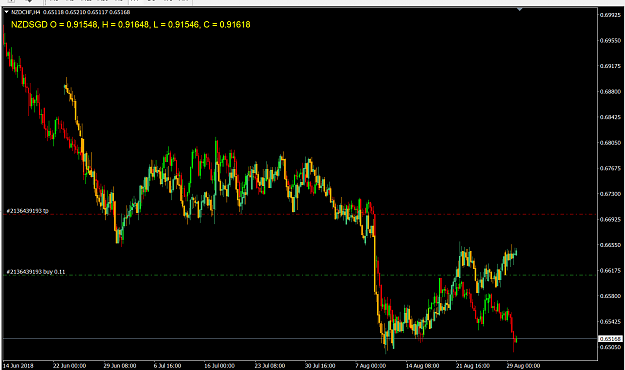
If it reversed at every top /bottom exact you would be a billionaire in a few months... Like the EUR/GBP.... It went though it.... But if you READ the thread you would learn the more it goes through the more it reverses.. AND YOU USE THE DAILY.... Just because it hits one doesn't mean it will just reverse.. But they are in zones where they do buy/sell...
This is my last post here ever... I have better things to do with my life...
Now you know why I have stopped posting and left this place... Besides the psycho stalkers, no one listens.... If it reversed at every top /bottom exact you would be a billionaire in a few months... Like the EUR/GBP.... It went though it.... But if you READ the thread you would learn the more it goes through the more it reverses.. AND YOU USE THE DAILY.... Just because it hits one doesn't mean it will just reverse.. But they are in zones where they do buy/sell... This is my last post here ever... I have better things to do with my life... {image}...
Now you know why I have stopped posting and left this place... Besides the psycho stalkers, no one listens.... If it reversed at every top /bottom exact you would be a billionaire in a few months... Like the EUR/GBP.... It went though it.... But if you READ the thread you would learn the more it goes through the more it reverses.. AND YOU USE THE DAILY.... Just because it hits one doesn't mean it will just reverse.. But they are in zones where they do buy/sell... This is my last post here ever... I have better things to do with my life... {image}...
Ignored
Great! Exactly.
Thank you very much for all. It will miss all your tips! I hope to see you again somewhere. Enjoy your life!
Now you know why I have stopped posting and left this place... Besides the psycho stalkers, no one listens.... If it reversed at every top /bottom exact you would be a billionaire in a few months... Like the EUR/GBP.... It went though it.... But if you READ the thread you would learn the more it goes through the more it reverses.. AND YOU USE THE DAILY.... Just because it hits one doesn't mean it will just reverse.. But they are in zones where they do buy/sell... This is my last post here ever... I have better things to do with my life... {image}...
Ignored
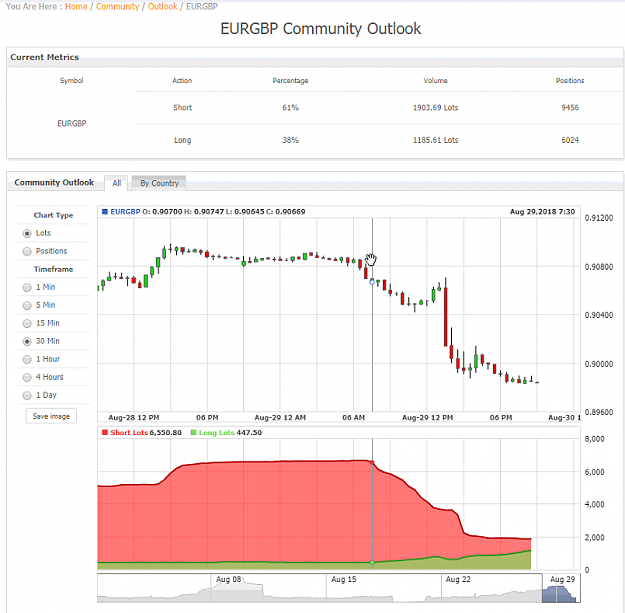
Hey Neil can you suggest what we do after the % fall under 70%?
For example this was from today few minutes before London open.
Attached Image (click to enlarge)
And this is now
Attached Image (click to enlarge)
I know that it was news fault for such a big move, but what is the best action here?
1. If % falls under 70% "without help" do we close or let it run?
2. If % falls under 70% "with help(news)" do we close or let it run?
Also I've noticed now that a lot of short positions were closed out till the news? Meaning? . So the contrarian trade was buy and the smart money is on buy but the retails started closing trades at London open and just before the news hit today? Seems really strange to me.
Attached Image (click to enlarge)
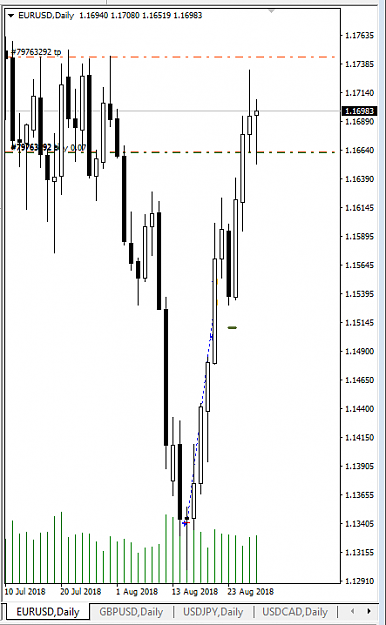
Anything above the line is an uptrend, below the line is a downtrend.
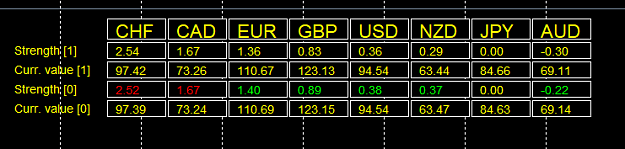
Months ago i posted this indicator based on one of neils idea's/tools.
Attached Image (click to enlarge)
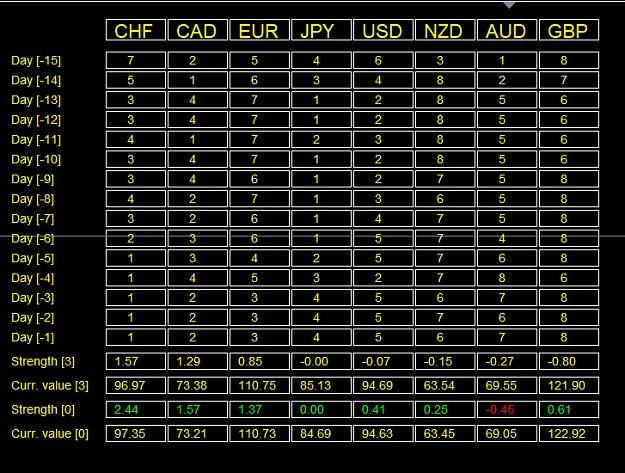
I extended the indi with the history of maximal 3 weeks.
So you have a better idea of what the currencies are doing in time.
You can see that JPY was for more then a week the strongest currency and is moving to the weakest.
Now CHF is alread for a week the strongest, so this one will also get weaker again and moving in the weaker regions.
1= strongest
8= weakest
Hi, Months ago i posted this indicator based on one of neils idea's/tools. {image} I extended the indi with the history of maximal 3 weeks. So you have a better idea of what the currencies are doing in time. You can see that JPY was for more then a week the strongest currency and is moving to the weakest. Now CHF is alread for a week the strongest, so this one will also get weaker again and moving in the weaker regions. 1= strongest 8= weakest {image} BR {file}
Ignored
Good job. Can you explain bottom 3 rows? Strength 3, curr. value 3,...
Anything above the line is an uptrend, below the line is a downtrend.
{quote} Good job. Can you explain bottom 3 rows? Strength 3, curr. value 3,...
Ignored
Hi,
[3], means calculation over the 200 H4 bars, but then shifted 3 H4 bars back, so in priciple you see the strength 12-15 hours back.
the ranking of the upper row (currencies) is based on [3]
[-1] is end of the day related to broker midnight.
3 = a setting, so if you make this value 6 then you look 1 day back.
[0] means actual H4 bar and calculation over the first 200 bars.
In the strength calculations are all related to JPY as reference ( always 0.0). And see it as a ranking.
Currency value is the average of 200 H4 bars for USDx, EURx, .........
Hope all clear now.
I tried to indicate by green and red color if the strength is changing in plus or minus.
This is a little tricky.
If the JPY gets weaker, all others become stronger, because JPY is the reference.
The opposite is also true.
I always also check the currency values.
BR
It is not important how often you fall down, but how often you get up again
{quote} Great analysis emonts, it´s possible we have your modified indi in order to do some charts tests please? Thanks
Ignored
Hi,
in the attachment below the indicator your asking for.
Some explanation
First the average over xx bars is calculated for pair 1.
Second the average over xx bars is calculated for pair 2.
All bars of pair 2 are corrected with the difference of the average pair 1 minus the average of pair 2.
If you compare 3 digit pair with 5 digit pair some more calculations are done, but not of importance for the understanding.
In the chart below you see two pairs in a chart with high negative correlation coefficient. Opposite behaviour.
You see the pairs have some times the same movements, then widening, narrowing and so on.
At negative correlation coefficient, pair 2 is mirrored.
Attached Image (click to enlarge)
In the chart below you see two pairs in a chart with high positive correlation coefficient. Same behaviour.
Attached Image (click to enlarge)
Mirroring yes/no is a setting.
Correlation coefficients between pairs you can find on the internet.
Take a rather long time for the coefficients.
I always use H4 bars and look for 10 weeks, 20 weeks and 30 weeks. 300, 600, 900 bars. It is a setting.
All coefficients must be for positive correlation > 0.8 and for negative correlation < -0.8;
Most website multiply these values by a factor of 100.0. Strange !
But also here we have some repainting. The calculation is always over the last xx bars. So every new bar can have influence.
But small influence.
That why i look over 3 periods.