Though I accept I have placed more positions than accostumed, truth is that trading at extreme levels releases all the stress and anxiety of whether the trade will go in favor or not.
Trading with a 1:200 leverage and keeping the Margin always above 1000% are some of the key ingredients to make money.
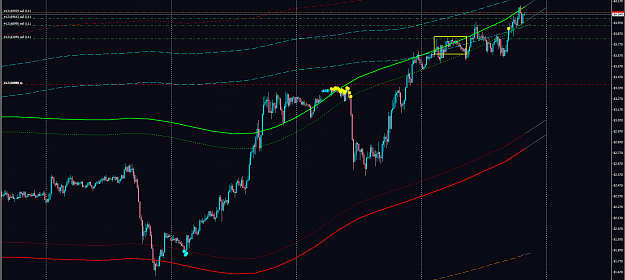
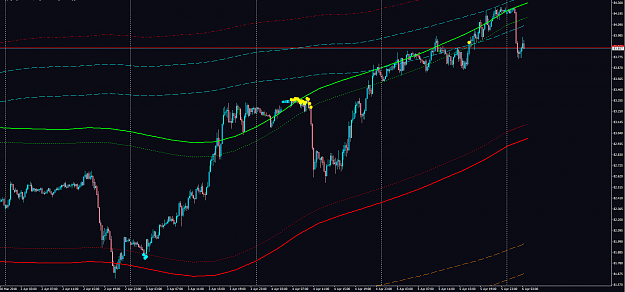
At this moment I have 2 trades open, one with 3 positions and another with 2, and the margin in my account is 5700%.
Both trades show the trend has entered very deep in the kitchen for a long period of time. So what is the only possible outcome provided the cycles are showing a turn? Answer: these pairs need to balance out.
I see everyone taking these H4 and Daily charts. Drawing S/R levels, drawing Fibo Lines, Pivots. It works. However, to me, is like re-inventing the wheel over and over. It's like if I had to code my system every time I want to place a trade.
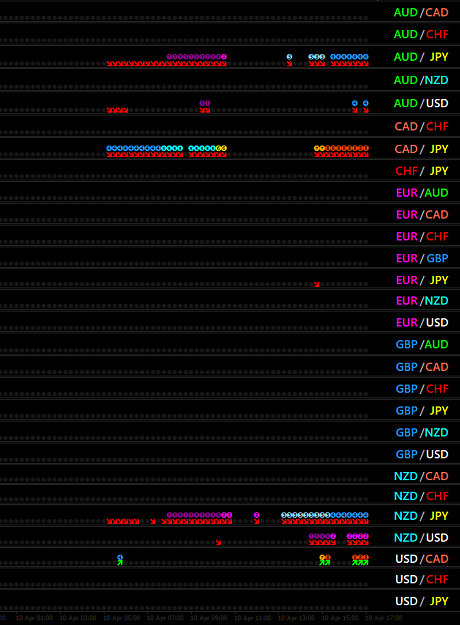
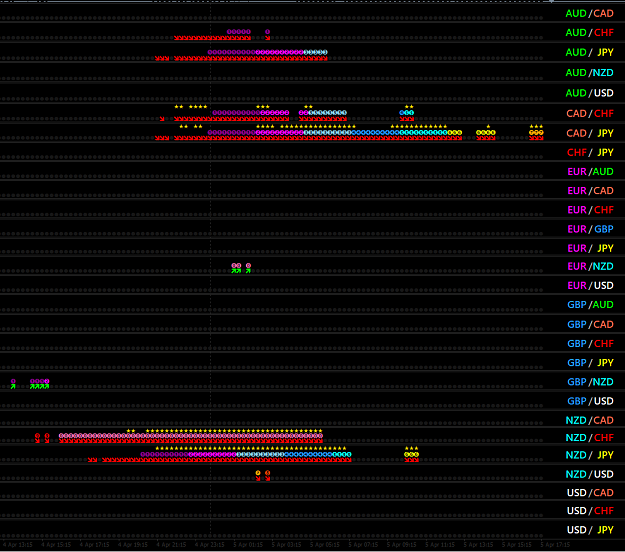
A successful system should be able to analyze itself without drawing absolutely anything. It should also be able to remove false signals, because true signals occure at key levels also provided by the system itself. So the system must provide two things: The Key Levels AND the Signals.
Every Pair Chart I have provide both things, but I cannot keep open 28 charts. So what I have done is to get the Key Levels information in one chart and then eye only those pairs that are providing trades at these levels to watch for the best signals.
Sunday and Monday trading was NULL, then tuesday the JPY pairs showed some activity, followed on Wednesday and Thursday with the CAD, CHF, NZD and JPY pairs.
What is everyone doing trading the GBP, EUR, AUD and USD goes beyond my understanding. If the GBP or EUR are not attached to one of the previous currency mentioned (cad, chf, nzd and jpy) then there are no opportunities there.
Surprisingly the NZD shows a lot of activity this week but the AUD is dead. Generally NZD and AUD pairs tend to show the same.
Trading with a 1:200 leverage and keeping the Margin always above 1000% are some of the key ingredients to make money.
At this moment I have 2 trades open, one with 3 positions and another with 2, and the margin in my account is 5700%.
Both trades show the trend has entered very deep in the kitchen for a long period of time. So what is the only possible outcome provided the cycles are showing a turn? Answer: these pairs need to balance out.
I see everyone taking these H4 and Daily charts. Drawing S/R levels, drawing Fibo Lines, Pivots. It works. However, to me, is like re-inventing the wheel over and over. It's like if I had to code my system every time I want to place a trade.
A successful system should be able to analyze itself without drawing absolutely anything. It should also be able to remove false signals, because true signals occure at key levels also provided by the system itself. So the system must provide two things: The Key Levels AND the Signals.
Every Pair Chart I have provide both things, but I cannot keep open 28 charts. So what I have done is to get the Key Levels information in one chart and then eye only those pairs that are providing trades at these levels to watch for the best signals.
Sunday and Monday trading was NULL, then tuesday the JPY pairs showed some activity, followed on Wednesday and Thursday with the CAD, CHF, NZD and JPY pairs.
What is everyone doing trading the GBP, EUR, AUD and USD goes beyond my understanding. If the GBP or EUR are not attached to one of the previous currency mentioned (cad, chf, nzd and jpy) then there are no opportunities there.
Surprisingly the NZD shows a lot of activity this week but the AUD is dead. Generally NZD and AUD pairs tend to show the same.
Attached Image (click to enlarge)
Best time to plant a tree was 20 years ago, second best is now