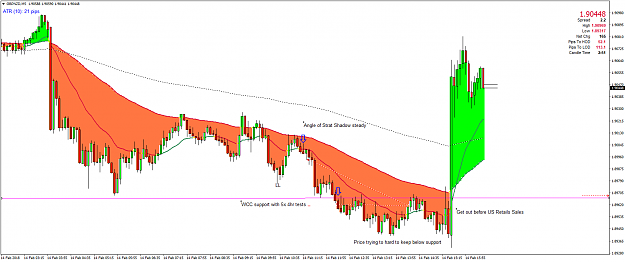
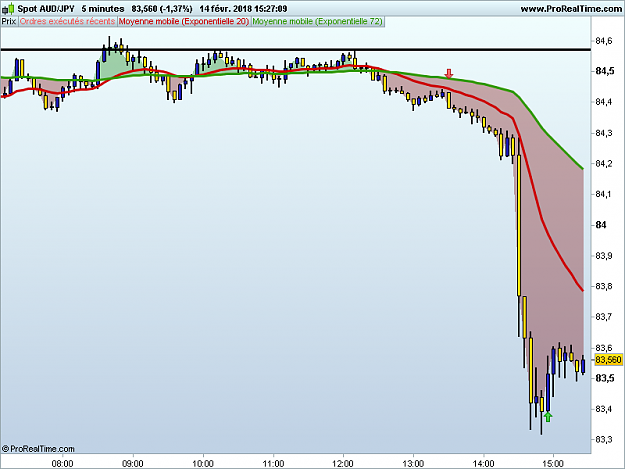
I took AUDJPY short about an hour before CPI. I thought it would nicely go down. I must say I didn't expect AUD and JPY to be the main currencies impacted by the US CPI...
Attached Image (click to enlarge)
2