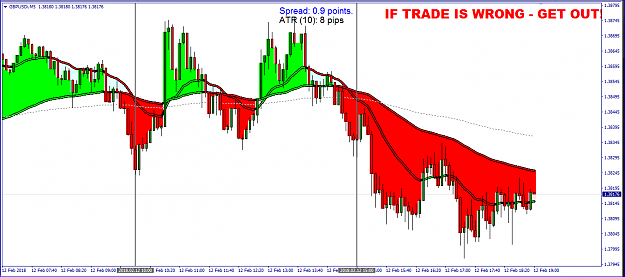
M5 GBP/NZD
This is how I played GBP/NZD Friday morning. I'm trading around the time I have in the morning between when I get up and leave for work and when I have available time at work, so keep that in mind.
On this trade I jumped back and forth between the M5 and M15 to confirm my entries and exits.
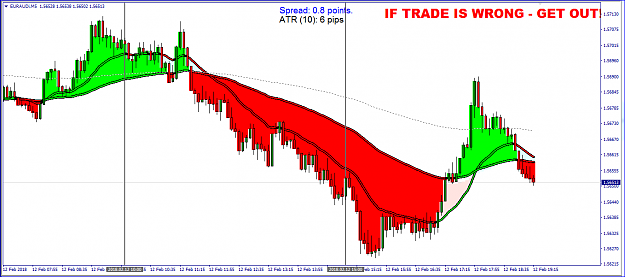
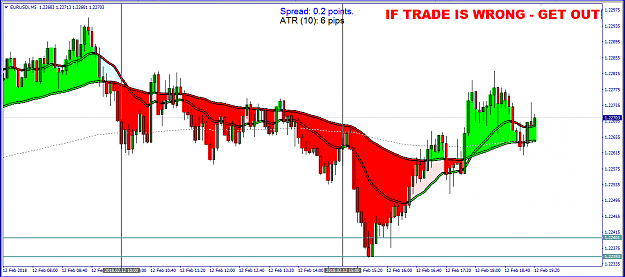
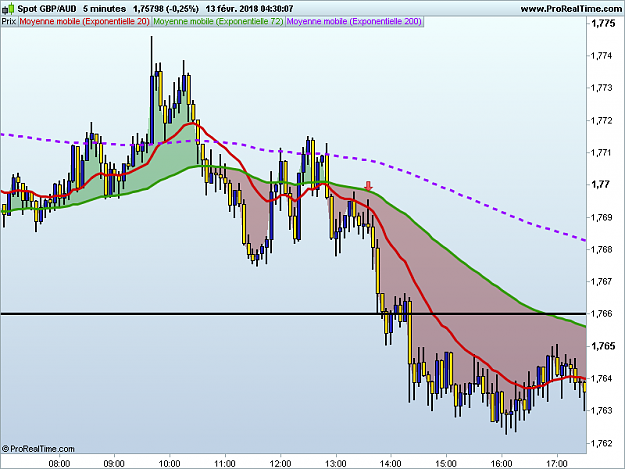
My M5 entry was not the cleanest but the M15 helped confirm. I saw 2 Doji style candles on the M5 and some longer wicks on the M15 relative to recent PA. With all this combined I used this as an entry. The Red arrow was my entry, but you also see with my trade on the chart. Also, the BETTER entry would have been at 15:40, take a look and you will see why.
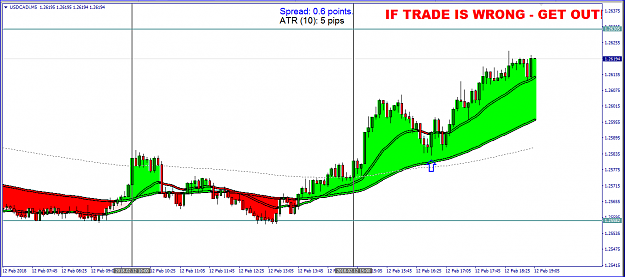
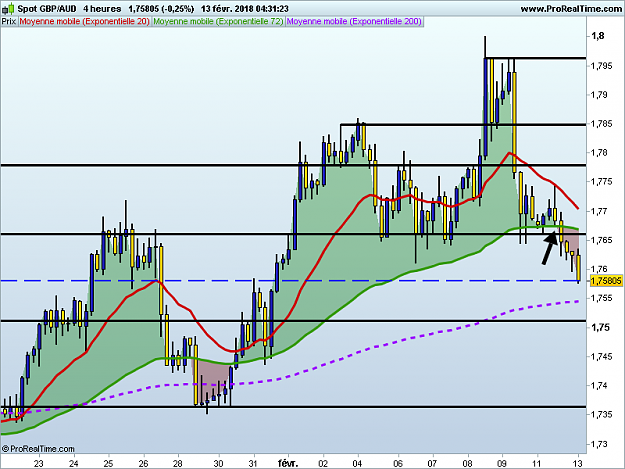
My exit was again a combination of the M5 and M15 confirming that price IS at a point of support and price action was telling me to call it. I had an area of support at 1.9028, see my M15 chart Blue rectangles. The M5 had some longer tails at this area relative to recent price action and the M15 showed the same. I also have support and BRN 1.9000 and a little below that at 1.8969. Price did end up going a little lower but I'm ok with that as the chart already told me to take my profit.
I wanted to post this because Strats post above on GBP/JPY is the exact process I go through when I'm going through my charts. If i see something that looks right, ill go through the higher time frames and pick out the S/R coming up, the PA that's happening, and how much more room there is until we get to the next S/R. The more you can line up in the direction you're trying to trade, the better!
Hope this helps anyone out!
This is how I played GBP/NZD Friday morning. I'm trading around the time I have in the morning between when I get up and leave for work and when I have available time at work, so keep that in mind.
On this trade I jumped back and forth between the M5 and M15 to confirm my entries and exits.
My M5 entry was not the cleanest but the M15 helped confirm. I saw 2 Doji style candles on the M5 and some longer wicks on the M15 relative to recent PA. With all this combined I used this as an entry. The Red arrow was my entry, but you also see with my trade on the chart. Also, the BETTER entry would have been at 15:40, take a look and you will see why.
Attached Image (click to enlarge)
My exit was again a combination of the M5 and M15 confirming that price IS at a point of support and price action was telling me to call it. I had an area of support at 1.9028, see my M15 chart Blue rectangles. The M5 had some longer tails at this area relative to recent price action and the M15 showed the same. I also have support and BRN 1.9000 and a little below that at 1.8969. Price did end up going a little lower but I'm ok with that as the chart already told me to take my profit.
Attached Image (click to enlarge)
I wanted to post this because Strats post above on GBP/JPY is the exact process I go through when I'm going through my charts. If i see something that looks right, ill go through the higher time frames and pick out the S/R coming up, the PA that's happening, and how much more room there is until we get to the next S/R. The more you can line up in the direction you're trying to trade, the better!
Hope this helps anyone out!