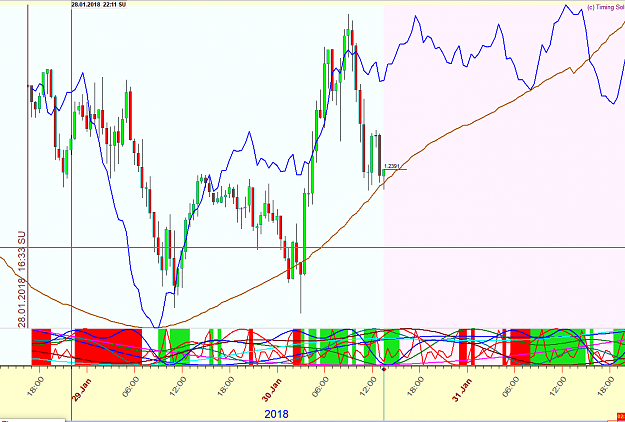
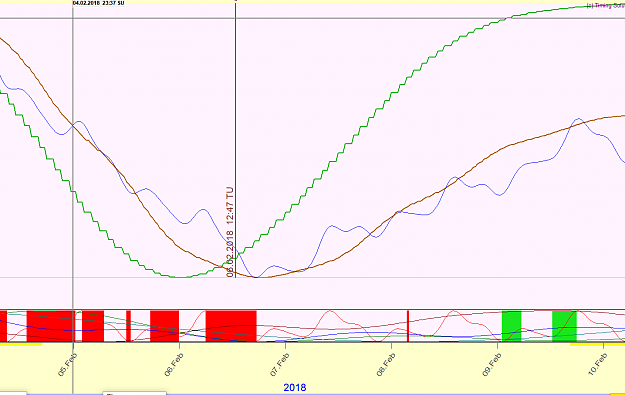
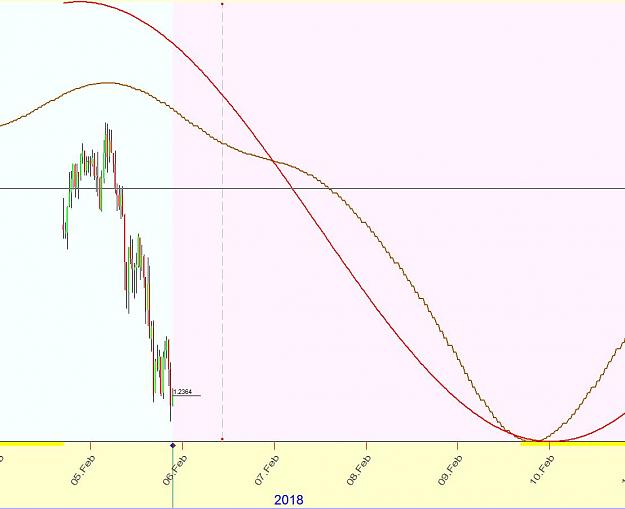
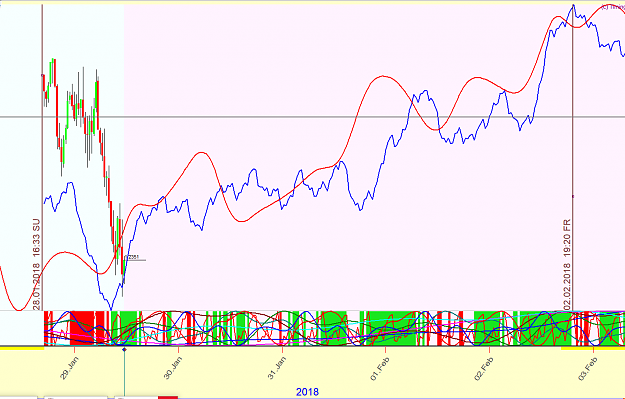
Monday noon update... using the full Q spectrum 10-5000 bars and auto selection
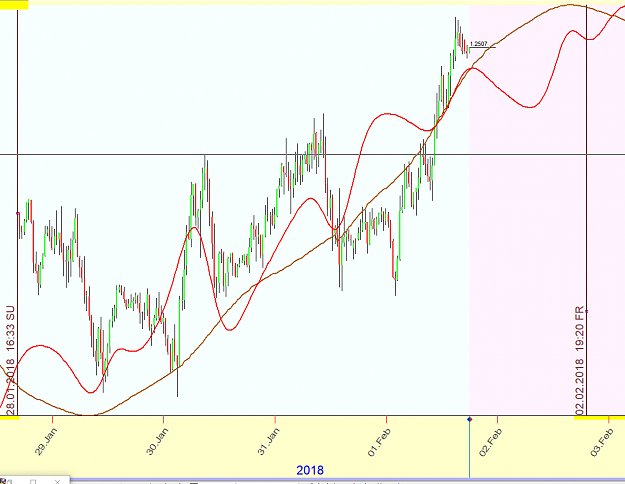
Red line is a composite of many aspects chosen by Timing Solution
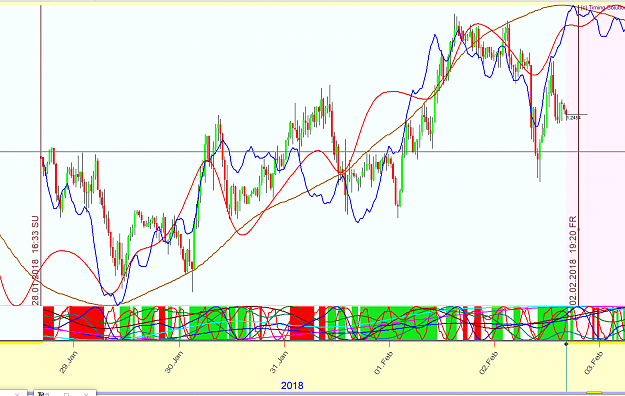
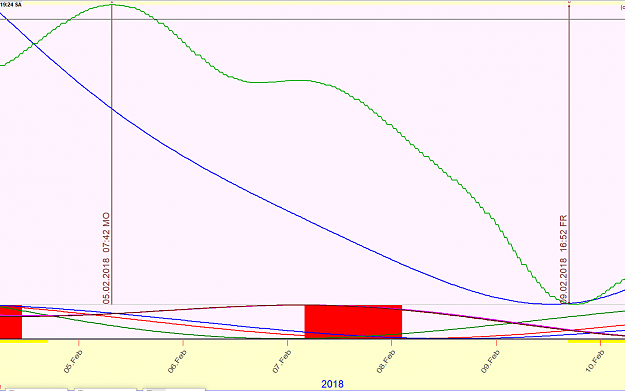
Red line is a composite of many aspects chosen by Timing Solution
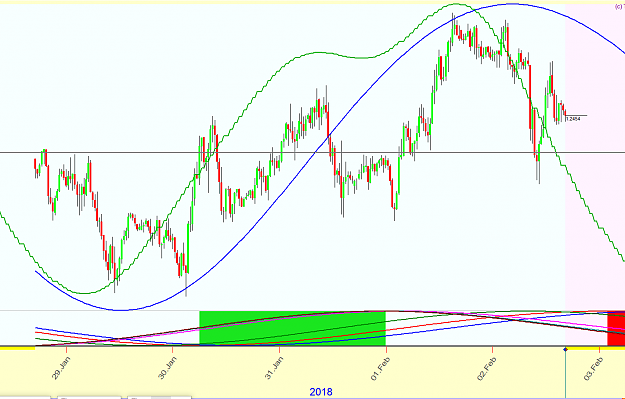
Attached Image (click to enlarge)
3