So can we first get a indicator developed to identify this pattern/formation, cuz as of right now all I see is a rejection on some MA (not sure what period) and the pattern hasnt really been described. Or am I missing something?
Ignored
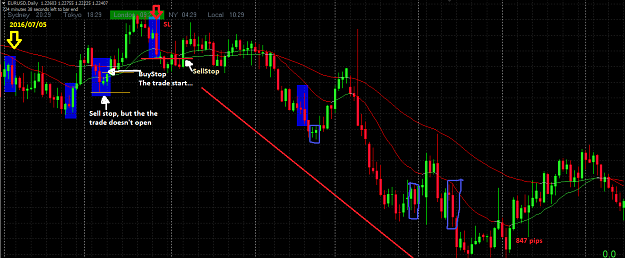
Hello, i don’t think you need a indicator. Actually it takes to me just 5 min for search on all 28 pairs. It’s a pattern very easy to spot
By the way, notice how a consolidation formed between the HIGHs of the two candles. Might be an opportunity on a lower tf.
I wonder how often this occurs.
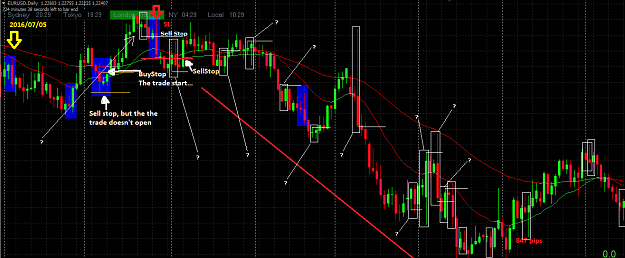
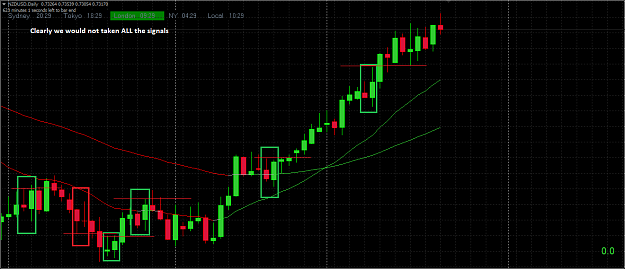
{quote} I think there is a lot more setups. If i'm wrong please correct me... {image}
Ignored
Yes you Are right. I’d not consider the candles with a very very long shadow and very small candles. But it’s all to verify and study! Thank you
anyway we would taken only the one with the red arrow, then we would moved the stop at least at BE. Because I think it s not a good idea add positions.
The ideal (and basic) setups for me are the screenshots number 2,3,4,5 in post 1
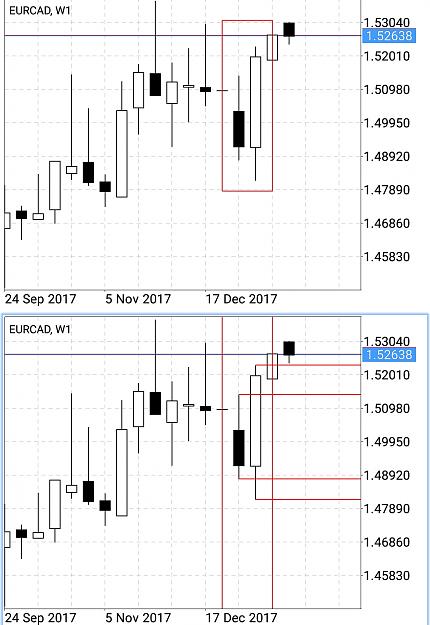
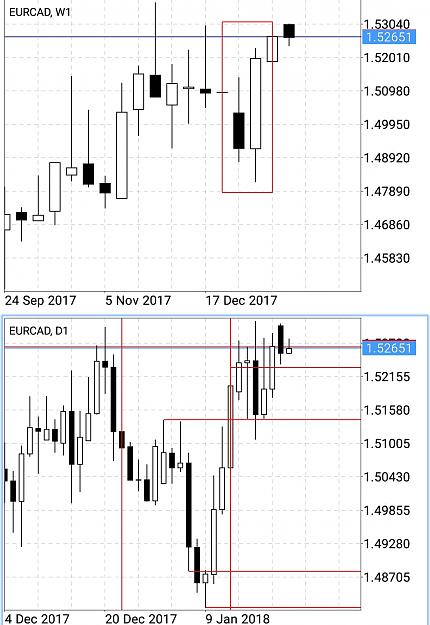
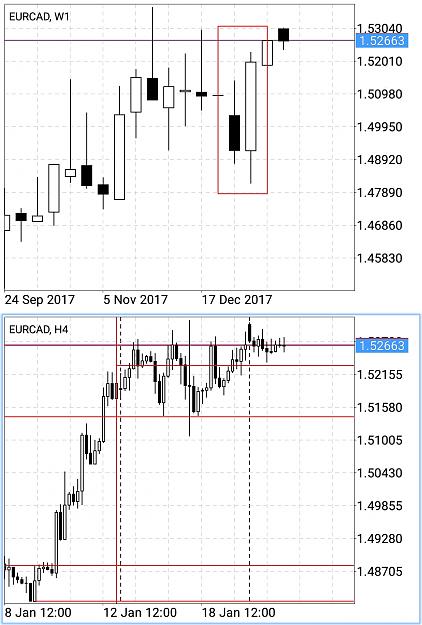
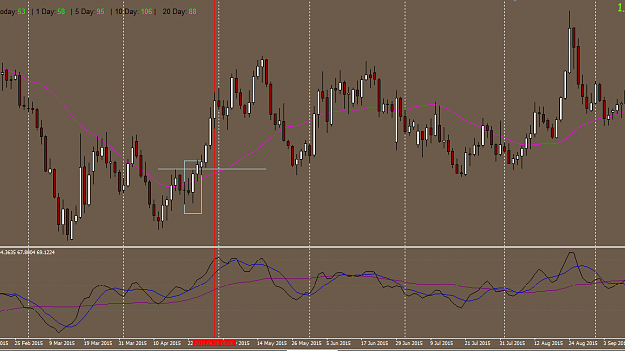
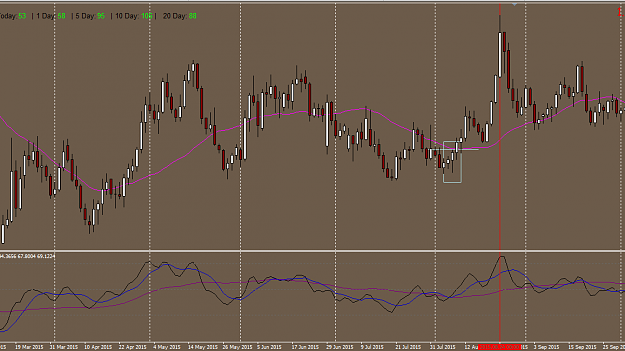
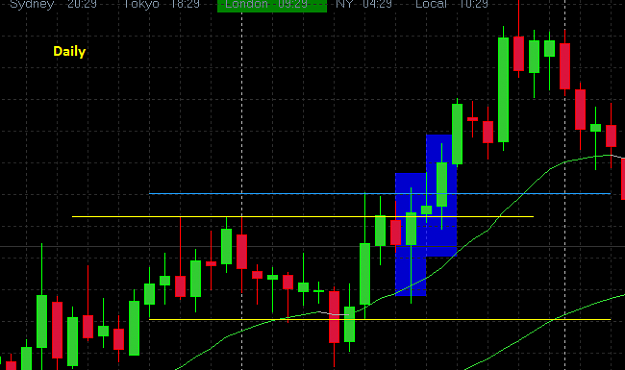
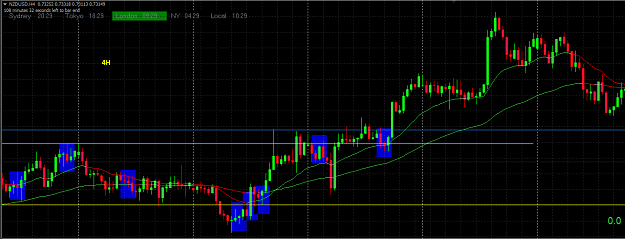
We can use an oscillator to exit our positions. For example if we take take a long we will exit when the price is overbought (70 line or whatever). The opposite for short positions. Obviously, this kind of exit works better if we take a position that agrees with the overall trend.
Look at the pictures. The rectangle is the pattern, the white horizontal line the point of entry and the vertical red line the point when the price reaches the overbought zone.
Attached Image(s) (click to enlarge)
Give me a lever long enough and a place to stand, and I will move the Earth
We can use an oscillator to exit our positions. For example if we take take a long we will exit when the price is overbought (70 line or whatever). The opposite for short positions. Obviously, this kind of exit works better if we take a position that agrees with the overall trend. Look at the pictures. The rectangle is the pattern, the white horizontal line the point of entry and the vertical red line the point when the price reaches the overbought zone. {image} {image}
Ignored
The problem is that some kind of oscillators when they are in overbought The pair is just trending and it could remain in overbought for 2 months. Elder say that there are two types of indicators, one is good for spot highs and lows, one for trends... we must choice the good one for this
“If you have an apple, and I have an apple, and we exchange it, then you and I always have an apple for one. But if you have an idea, and I have an idea, and we exchange it, then we both have two ideas”
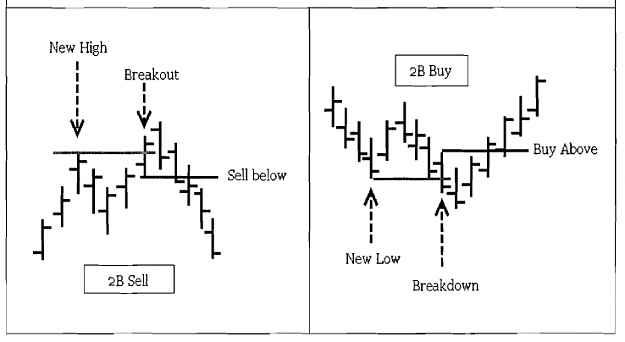
Nice system, what makes this pattern important is that its a wick pattern + CS pattern, (wick)short/long + (CS)Bull/Bear means sell, (wick)short/long + (CS)bear/bull means buy
Grind until you no longer have to introduce yourself. 4:30am club
Nice system, what makes this pattern important is that its a wick pattern + CS pattern, (wick)short/long + (CS)Bull/Bear means sell, (wick)short/long + (CS)bear/bull means buy
Ignored
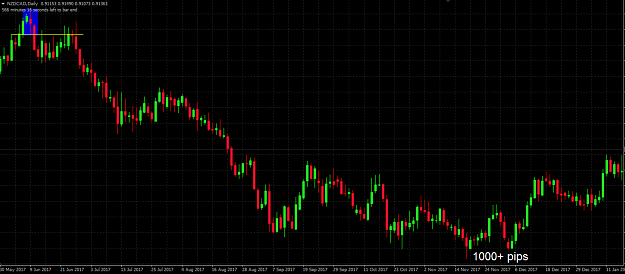
And i think also that the point of strength of this "entry method" is that the SL is tight compared to the potential TP: If you lose one, you'll recover with interest in the next trade
{quote} And i think also that the point of strength of this "entry method" is that the SL is tight compared to the potential TP: If you lose one, you'll recover with interest in the next trade
Ignored
Yes, I go for at least 1:3 using a system with the same signal for entry and multi time frame.
Grind until you no longer have to introduce yourself. 4:30am club