|
Joined Jul 2006
|
Status: Pay the man ! !
|912 Posts
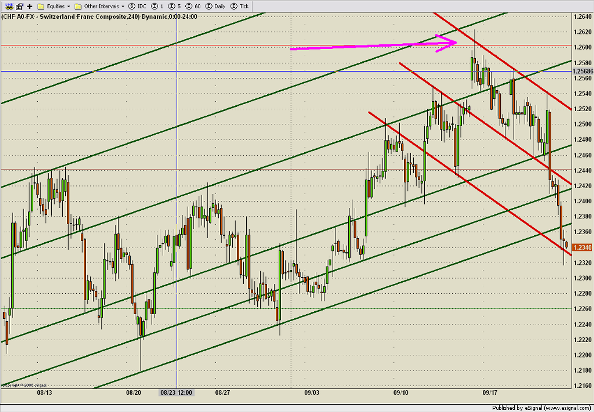
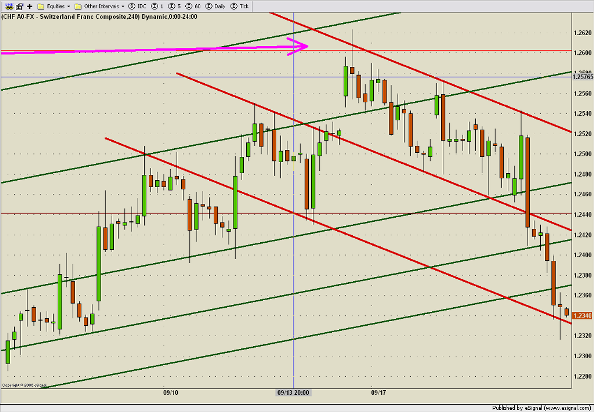
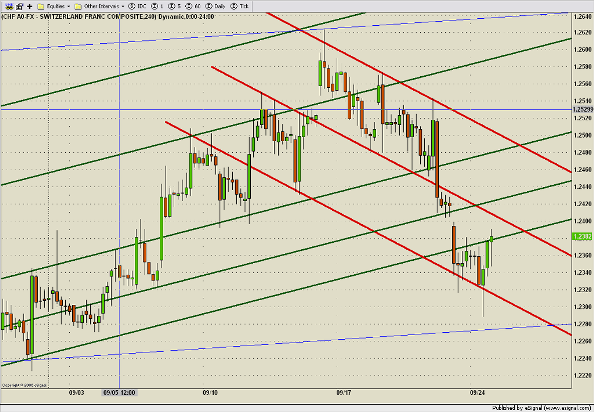
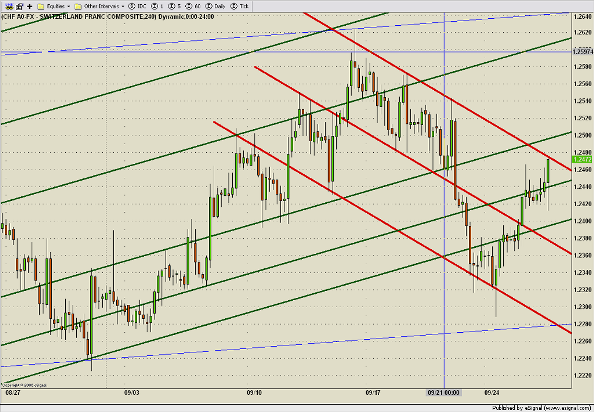
Here is some interesting little clues that often shows signs of impending weakness. Look at the arrow on the below charts and notice that on the last high, the Franc failed to reach the top of the channel before reversing. Also notice the big wick on the candle. Two very good hints
That may be enough to consider holding for a break of the bottom of the channel instead of taking profit on a touch of that lower line.
|
Joined Jul 2006
|
Status: Pay the man ! !
|912 Posts
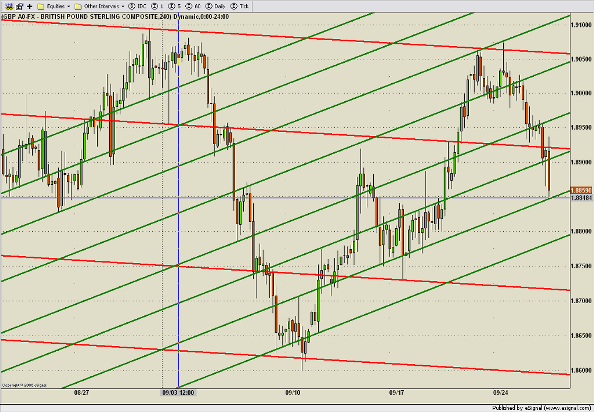
It is amazing how well the dollar crosses are "behaving" for the technical analysis guys. This is when the extra work of learning the classics pays off.
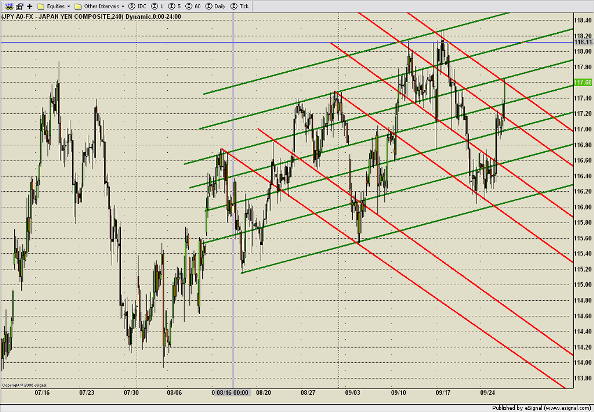
I use a tool almost nobody use in MT4 and is called Fibonacci channel. I modified the tool so the extension part draw a second channel.
It has the versatility of equidistant channel tool and is very easy to apply.
Great thread, thanks! Could you describe how you go about drawing your lines to those of us new to this? i.e. to you pick significant highs/lows to draw a first trendline from and then look for parallel correlations or is there more to it? What I'd like to get a sense of is your thought process when you sit down at a new chart and try to determine the current trend (and maybe developing trend?). Secondly, a description of the horizontal lines on a few of the charts (someone mentioned Murray math?) would be appreciated as well. How do you go about drawing these and also are intersections between lines of special importance?
|
Joined Jul 2006
|
Status: Pay the man ! !
|912 Posts
Quoting Tragapips
Disliked
I use a tool almost nobody use in MT4 and is called Fibonacci channel. I modified the tool so the extension part draw a second channel.
It has the versatility of equidistant channel tool and is very easy to apply.
|
Joined Jul 2006
|
Status: Pay the man ! !
|912 Posts
Quoting bluemeasure
Disliked
Hi FXOpportunist,
Great thread, thanks! Could you describe how you go about drawing your lines to those of us new to this? i.e. to you pick significant highs/lows to draw a first trendline from and then look for parallel correlations or is there more to it? What I'd like to get a sense of is your thought process when you sit down at a new chart and try to determine the current trend (and maybe developing trend?). Secondly, a description of the horizontal lines on a few of the charts (someone mentioned Murray math?) would be appreciated as well. How do you go about drawing these and also are intersections between lines of special importance?
Thanks much,
BlueMeasure
Ignored
Hello BlueMeasure,
If you read my posts from the beggining, there are several posts that explain how I found these channels and how I draw them. After reading those posts, feel free to ask me any specific questions you have.
One more thing I will offer is just put up a 4 hr chart, zoom out till you can see about 3 months and then start drawing psychotic trend lines until you see one trend line angle that has consistent correllations at all of the significant levels. That is the fastest way to get started.
|
Joined Jul 2006
|
Status: Pay the man ! !
|912 Posts
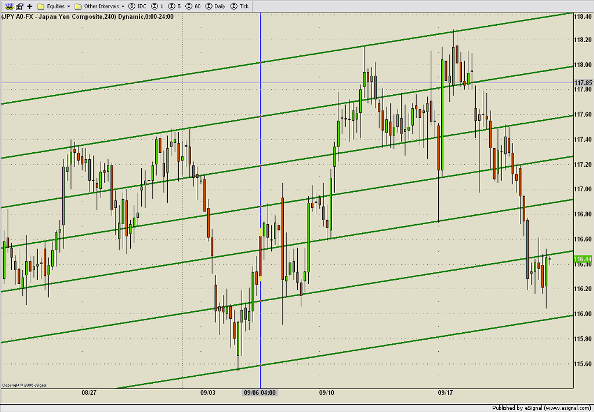
We contimnue to see amazing technical behavior. Today we had perfect reaction to the price channels on the home sales spike. Now the strategy for holding is to move the stops into the money and just ride it to the next price channel line.
|
Joined Jul 2006
|
Status: Pay the man ! !
|912 Posts
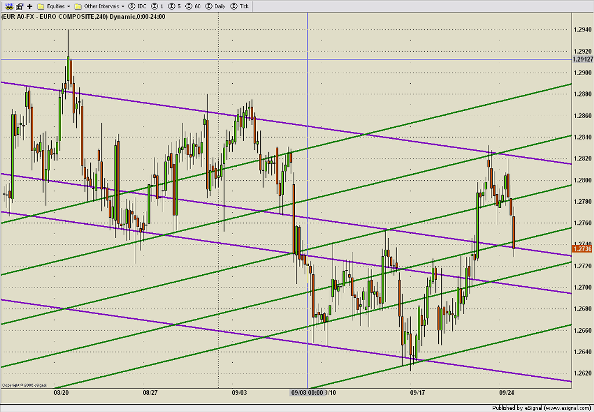
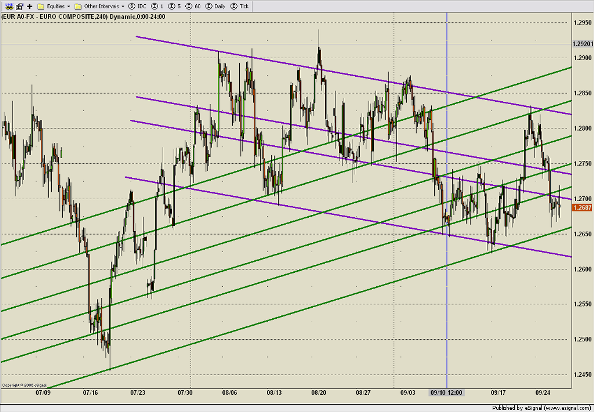
Here is the 4 HR euro chart. As you can see the price fell short of the lines I had chosen. No trade off of this chart today. I am also considereing some different angles that may fit better.
You can customize the tool the way you want. By default there are no level inside the primary lines but you can add those level putting negative values in levels tab of property box indicator: -0.5,-0.618,-0.382. Play with the tool I know it can saves you a lot of work.
|
Joined Jul 2006
|
Status: Pay the man ! !
|912 Posts
I see some good corrollations in there but it is pretty busy for my tastes. I wouldn't know whta to play. Can you zoom out some to see the bigger picture?