Decided to repost this here as its a very interesting article. All credit goes to alotmorealots over on Reddit.
One of the things that surprises many newbies to the forex world is that some forms of insider trading aren't illegal. Front running is the practice of taking a position with the knowledge that there is a large order coming through behind you to push the market in your favour, and it's been generally accepted that this is just the way of things in the spot market, even if it's been outlawed in futures and equities.
However, a recent landmark case means that this may no longer be the case.
Former HSBC Holdings Plc currency trader Mark Johnson was found guilty of fraud for front-running a $3.5 billion client order, a victory for U.S. prosecutors as they seek to root out misconduct in global financial markets.
He was convicted on Monday on nine of 10 fraud and conspiracy counts after a month-long trial in Brooklyn, New York.
(https://www.bloomberg.com/news/artic...-front-running)
It is hard to know exactly what impact this will have on the markets, given that many traders will look at this case and note that: a) there was fall out because the HSBC desk execution acted against the interest of their client, rather than the front running per se b) there was active conspiracy with other traders c) the run was into the fix, rather than less watched times of the day.
I haven't read the case details though, so perhaps there is actual specificity against the practice. Systemic risk averse (not the same as market risk aversion) institutions may be less willing to engage in the practice, and certainly it seems to continue the push towards removing the human element altogether.
-- // --
What's even more interesting for spot traders who can't front run, is the detailed look behind the scenes that the case gives us, as it clearly outlines the actual events in the real world that translate into price movement.
Timeline of events
1) Cairn Energy PLC, an oil and gas company begin talks to sell a 51.8% share of their Cairn India subsidiary in late 2010 for $8.7 billion
2) Approval from the Indian government doesn't come through until September 2011
3) Cairn Energy place an order with HSBC to convert 3.5 billion dollars from the asset sale to pounds in December 2011
4) HSBC desk traders accumulate GBPUSD longs in anticipation of the big order
5) The desk trader responsible for putting through the 3.5 billion trade 'ramps' the order through just before the fix, all traders then close out positions.
References: https://en.wikipedia.org/wiki/Cairn_Energy https://www.law360.com/articles/9720...-5b-forex-deal
https://www.bloomberg.com/news/artic...price-of-pound
-- // --
Now for those of you who are already aware that this sort of activity occurs, this isn't news, just open confirmation of what was assumed to take place.
More fascinating though are the position size and timing information, which give proper insight into market dynamics.
You should read this full article to get the best understanding: https://www.bloomberg.com/news/artic...ory-of-a-crime
-- // --
These are the charts in question:
Reuters Buying Market M5 volume chart showing HSBC share
https://i.imgur.com/bXBN2BC.jpg
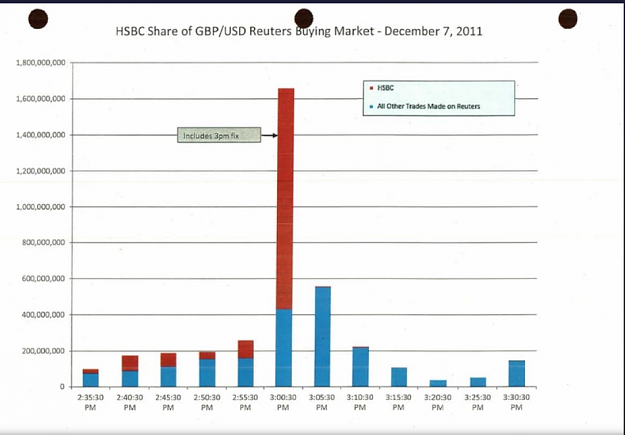
For all that's said about spot forex having 'no true centralised volume' etc, this is an incredibly telling graphic of just how much a major player can dominate the interbank market and leave a very meaningful and tell-tale spike, even at the fix. Additionally that's 1.6BN notional moved in five minutes.
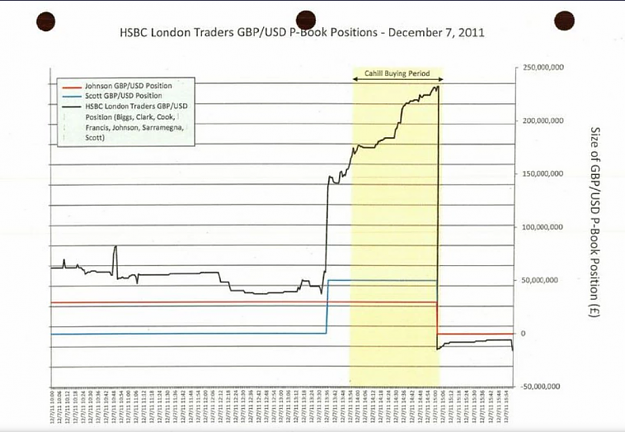
Prop book position sizes for HSBC London and HSBC NY
https://i.imgur.com/MhRPGWJ.jpg
https://i.imgur.com/krBztbX.jpg
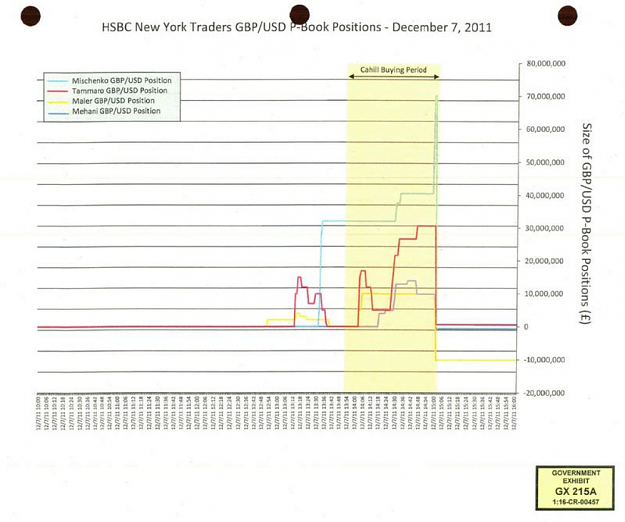
There is a lot of information in these charts if you're willing to dig down into them. You can see the size of individual HSBC bank traders' positions, how much they change them, how long they hold them for, and how quickly they exit them.
It's worth nothing that the increments on the horizontal axis are 6 minutes, meaning the standard position hold length was often only in hours, with size reaching up to $70M for the NY traders.
The London traders had quite different styles, one of them running a frequently adjusting multiple small trades inside their larger position, one of them running a static short for much of the day before flipping to the long as they were alerted to the front-running opportunity.
In addition to liquidating their positions into the $3.5bn client order, many also shorted off the peak, although didn't close out in the given time period.
Actual spot price vs HSBC trader position size
https://i.imgur.com/Qc1Kart.jpg
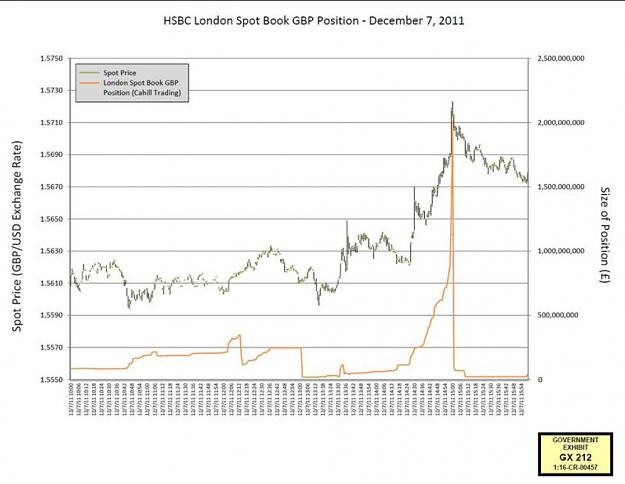
This is particularly fascinating, because it's rare to see the spot price superimposed over the genuine very high volume buying activity.
Having looked through these charts, it's important to take a step back and think about how it all fits together: corporate activity outside of the market, leading to a major forex order, leading to the constant aggressive buying driving price up over an hour, and then the sharp position exits causing price to peak.
How you would have perceived this depends on your lens to the market. Perhaps it looked to you like a particular candle formation, maybe a test of resistance, maybe a breach of resistance. Perhaps you saw it as a big volume stomp on the DoM. Maybe it was just 'noise' (even though it represented a genuine commercial event). Maybe it formed part of harmonic, or crossed an average, triggered an automated algor entry.
But price doesn't move about for abstract reasons from minute to minute, hour to hour - it's driven by real world events that will never register on your radar, like the Cairn's Indian subsidiary sale, which then manifests when bank traders make decisions with client money and bank prop money on the side.
Whether or not this should factor into your trading depends on a combination of your personality, mental model of the market and your trading style. But new traders should always be very wary of approaches to the market that can not account for the information that can be seen about how the market operates when criminal investigations pull back the curtains.
One of the things that surprises many newbies to the forex world is that some forms of insider trading aren't illegal. Front running is the practice of taking a position with the knowledge that there is a large order coming through behind you to push the market in your favour, and it's been generally accepted that this is just the way of things in the spot market, even if it's been outlawed in futures and equities.
However, a recent landmark case means that this may no longer be the case.
Former HSBC Holdings Plc currency trader Mark Johnson was found guilty of fraud for front-running a $3.5 billion client order, a victory for U.S. prosecutors as they seek to root out misconduct in global financial markets.
He was convicted on Monday on nine of 10 fraud and conspiracy counts after a month-long trial in Brooklyn, New York.
(https://www.bloomberg.com/news/artic...-front-running)
It is hard to know exactly what impact this will have on the markets, given that many traders will look at this case and note that: a) there was fall out because the HSBC desk execution acted against the interest of their client, rather than the front running per se b) there was active conspiracy with other traders c) the run was into the fix, rather than less watched times of the day.
I haven't read the case details though, so perhaps there is actual specificity against the practice. Systemic risk averse (not the same as market risk aversion) institutions may be less willing to engage in the practice, and certainly it seems to continue the push towards removing the human element altogether.
-- // --
What's even more interesting for spot traders who can't front run, is the detailed look behind the scenes that the case gives us, as it clearly outlines the actual events in the real world that translate into price movement.
Timeline of events
1) Cairn Energy PLC, an oil and gas company begin talks to sell a 51.8% share of their Cairn India subsidiary in late 2010 for $8.7 billion
2) Approval from the Indian government doesn't come through until September 2011
3) Cairn Energy place an order with HSBC to convert 3.5 billion dollars from the asset sale to pounds in December 2011
4) HSBC desk traders accumulate GBPUSD longs in anticipation of the big order
5) The desk trader responsible for putting through the 3.5 billion trade 'ramps' the order through just before the fix, all traders then close out positions.
References: https://en.wikipedia.org/wiki/Cairn_Energy https://www.law360.com/articles/9720...-5b-forex-deal
https://www.bloomberg.com/news/artic...price-of-pound
-- // --
Now for those of you who are already aware that this sort of activity occurs, this isn't news, just open confirmation of what was assumed to take place.
More fascinating though are the position size and timing information, which give proper insight into market dynamics.
You should read this full article to get the best understanding: https://www.bloomberg.com/news/artic...ory-of-a-crime
-- // --
These are the charts in question:
Reuters Buying Market M5 volume chart showing HSBC share
https://i.imgur.com/bXBN2BC.jpg
Attached Image (click to enlarge)
For all that's said about spot forex having 'no true centralised volume' etc, this is an incredibly telling graphic of just how much a major player can dominate the interbank market and leave a very meaningful and tell-tale spike, even at the fix. Additionally that's 1.6BN notional moved in five minutes.
Prop book position sizes for HSBC London and HSBC NY
https://i.imgur.com/MhRPGWJ.jpg
Attached Image (click to enlarge)
https://i.imgur.com/krBztbX.jpg
Attached Image (click to enlarge)
There is a lot of information in these charts if you're willing to dig down into them. You can see the size of individual HSBC bank traders' positions, how much they change them, how long they hold them for, and how quickly they exit them.
It's worth nothing that the increments on the horizontal axis are 6 minutes, meaning the standard position hold length was often only in hours, with size reaching up to $70M for the NY traders.
The London traders had quite different styles, one of them running a frequently adjusting multiple small trades inside their larger position, one of them running a static short for much of the day before flipping to the long as they were alerted to the front-running opportunity.
In addition to liquidating their positions into the $3.5bn client order, many also shorted off the peak, although didn't close out in the given time period.
Actual spot price vs HSBC trader position size
https://i.imgur.com/Qc1Kart.jpg
Attached Image (click to enlarge)
This is particularly fascinating, because it's rare to see the spot price superimposed over the genuine very high volume buying activity.
Having looked through these charts, it's important to take a step back and think about how it all fits together: corporate activity outside of the market, leading to a major forex order, leading to the constant aggressive buying driving price up over an hour, and then the sharp position exits causing price to peak.
How you would have perceived this depends on your lens to the market. Perhaps it looked to you like a particular candle formation, maybe a test of resistance, maybe a breach of resistance. Perhaps you saw it as a big volume stomp on the DoM. Maybe it was just 'noise' (even though it represented a genuine commercial event). Maybe it formed part of harmonic, or crossed an average, triggered an automated algor entry.
But price doesn't move about for abstract reasons from minute to minute, hour to hour - it's driven by real world events that will never register on your radar, like the Cairn's Indian subsidiary sale, which then manifests when bank traders make decisions with client money and bank prop money on the side.
Whether or not this should factor into your trading depends on a combination of your personality, mental model of the market and your trading style. But new traders should always be very wary of approaches to the market that can not account for the information that can be seen about how the market operates when criminal investigations pull back the curtains.