Tibetian,
I'm very grateful that you found the time to make so precise answer. Since you make it perfectly clear what we can expect as a true MPL I will ask about setting targets.
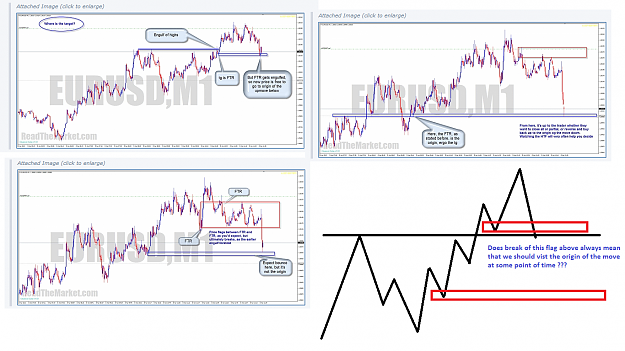
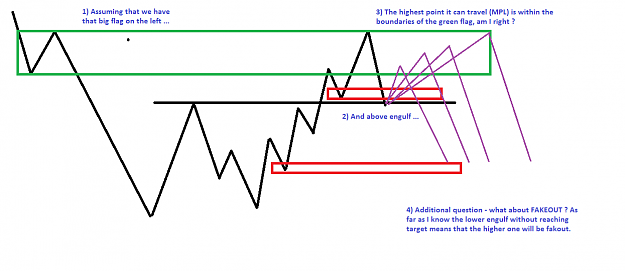
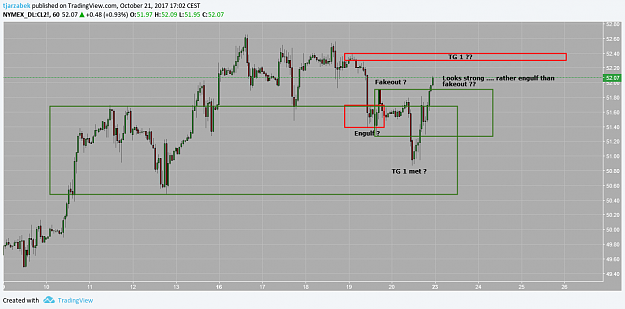
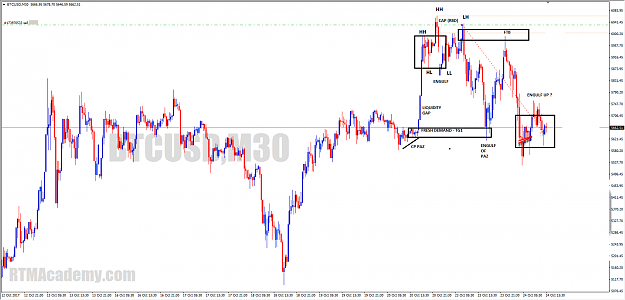
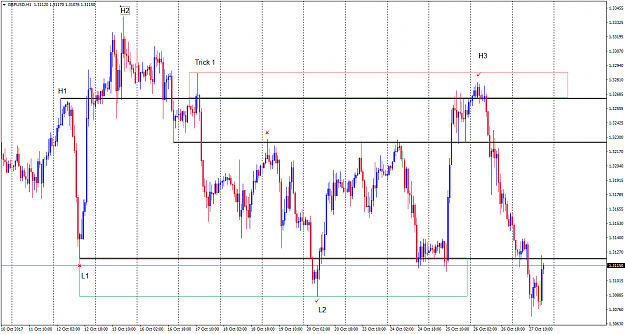
Based on IF's charts at the front page we should aim at the origin of the move lower if new created flag (after engulfing the old one to the upside) is breached to the downside. I would like to know if it's a rule. Moreover are we able to pinpoint the entry so that there is no look back (so in my example breaching flag to the downside after MPL being set .... either at the very top of the green flag or after ... fakeout ?)
I'm very grateful that you found the time to make so precise answer. Since you make it perfectly clear what we can expect as a true MPL I will ask about setting targets.
Based on IF's charts at the front page we should aim at the origin of the move lower if new created flag (after engulfing the old one to the upside) is breached to the downside. I would like to know if it's a rule. Moreover are we able to pinpoint the entry so that there is no look back
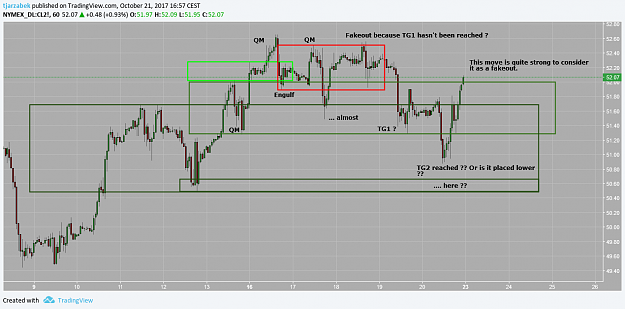
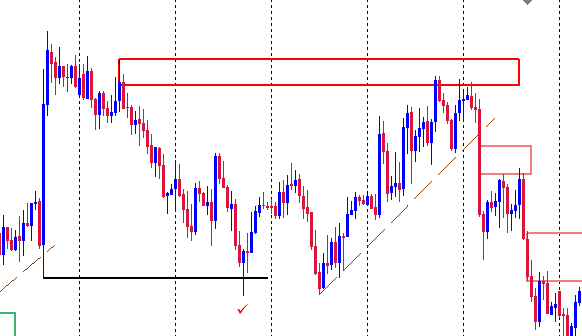
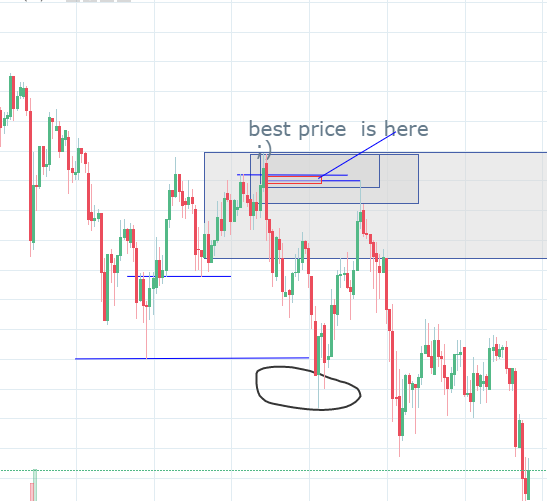
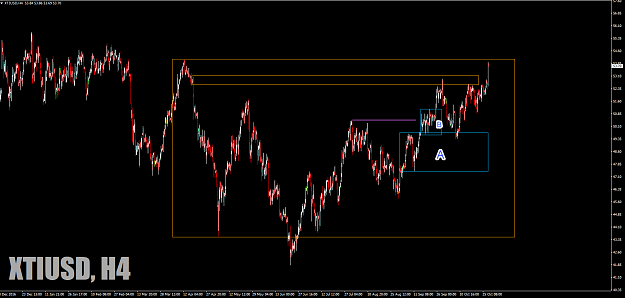
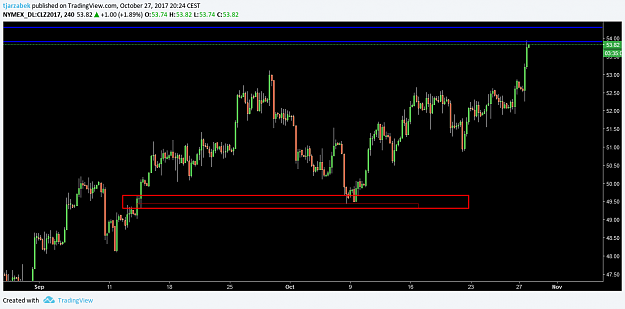
DislikedHi Vinsanity, that sure looks like a QM, but IMHO the MPL is a little higher. Please take a look at my chart below. I use orange boxes to represent FLs that hold price down, and blue boxes to represent FLs that hold price up. Further, I use 'triangle' to represent compression zone. (I know RTM uses dotted lines, but I think dotted line on tradingview looks ugly, so I prefer to use triangle). I didn't draw ALL the FLs that I saw because it will make the chart unreadable. I just use this to highlight the most important part of my thinking: {image}...Ignored
Attached Image(s) (click to enlarge)