lets take the last 20 bars. you take the average of the close (maybe 20 SMA) and measure the distance of each bar to the MA. the smaller the value the higher the choppiness.
Ignored
You need to take the lag of the MA into account otherwise the trend will bias your measurement. A strong swing will make the price depart from the MA and create a very high value yet the move is very smooth. With a SMA20 you shall compare with the price 10 bars ago. This implies the uses of a linear phase lowpass filter (SMA is OK but LWMA or EMA aren't)
{quote} This is not true. Here is a counter-example. Let's normalize E/J and E/U so that they both start at index 1: E/U: 1 +2 -1 +3 E/J: 1 +1 -0.5 +1.5 Every step in E/JU is twice the size in E/J. Their correlation is 1. Their values over time is: E/U: 1 3 2 5 E/J: 1 2 1.5 3 U/J = E/J / E/U. So over time U/J: 1 2/3 3/4 3/5 It's not constant
Ignored
i dont get the example can you explain it better? cause it makes no sense in my logic. i asume that a correlation of 1 is the exact same move on both pairs with the same power if not then i dont understand the correlation index.
{quote} This is not true. Here is a counter-example. Let's normalize E/J and E/U so that they both start at index 1: E/U: 1 +2 -1 +3 E/J: 1 +1 -0.5 +1.5 Every step in E/JU is twice the size in E/J. Their correlation is 1. Their values over time is: E/U: 1 3 2 5 E/J: 1 2 1.5 3 U/J = E/J / E/U. So over time U/J: 1 2/3 3/4 3/5 It's not constant
Ignored
You can't normalize the pricing because that breaks the fundamental mathematical foundation of how all forex pairs are priced. All pairs are just fractions (one currency over another), and each pair's price is a derivative of relative value. The following equation represents a perfectly efficient market: (A/B)(B/C)(C/A) = 1
If this is ever not equal to 1 (or close to it) then the big-boy HFT firms arb out the inefficiency in milliseconds. So for the sake of argument, we'll assume that your naked eye will never see a scenario where that equation != 1. In case you want to learn more
In short, you cannot change A/B without having a direct effect on B/C or C/A or both, because arbitrageurs make it so.
Assuming our efficient market scenario, EU and EJ can have violent swings but as long as they remain perfectly correlated then UJ would remain flat.
Two variables X and Y are correlated if there exists a linear relationship between X and Y (Y ~ aX + b + noise). They needn't be equal to have a correlation of 1. https://en.wikipedia.org/wiki/Correl...and_dependence
{quote} You can't normalize the pricing because that breaks the fundamental mathematical foundation of how all forex pairs are priced. All pairs are just fractions (one currency over another), and each pair's price is a derivative of relative value. The following equation represents a perfectly efficient market: (A/B)(B/C)(C/A) = 1 If this is ever not equal to 1 (or close to it) then the big-boy HFT firms arb out the inefficiency in milliseconds. So for the sake of argument, we'll assume that your naked eye will never see a scenario where that equation...
Ignored
A price series is normalized by dividing all the elements of the series by the first element. This way it starts at 1. This violates nothing. Check it for yourself.
{quote} A price series is normalized by dividing all the elements of the series by the first element. This way it starts at 1. This violates nothing. Check it for yourself.
Ignored
I see what you're saying now... My bad.
Has anyone suggested using the slope and magnitude of a moving linear regression channel?
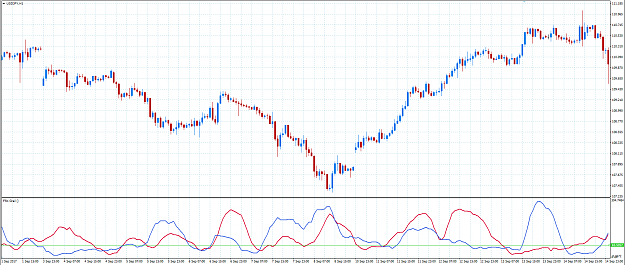
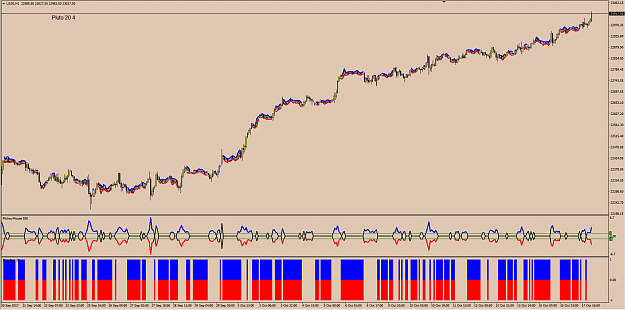
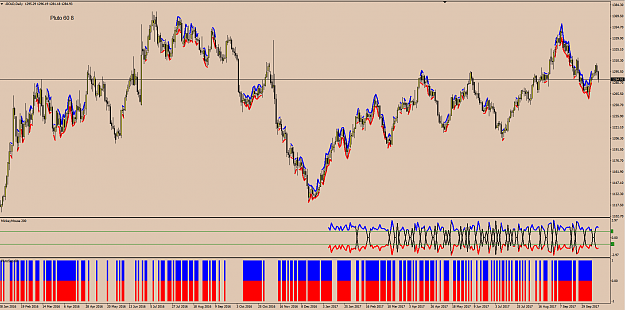
this is what you get with 20SMA and 10 bars. the green line represents some sort of an average which is a different story.
looks more like a trend finder but this is what i understand under choppy markets.
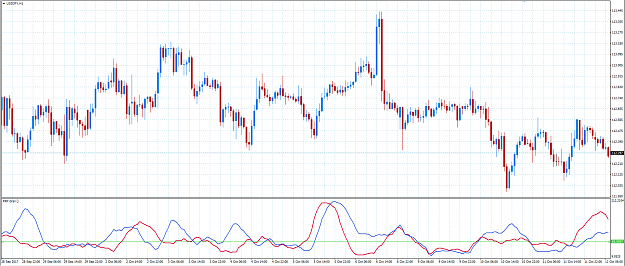
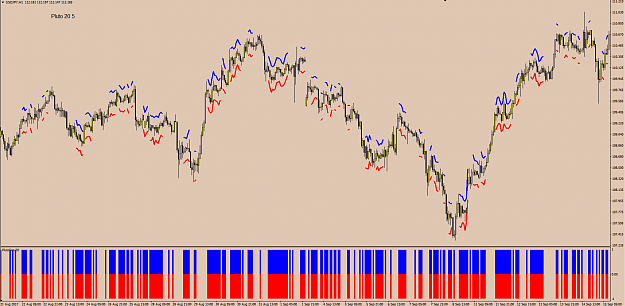
theory is the blue USD and the red JPY lines have to be over the average. now maybe i try to filter out big price spikes but this could even lower the reliability.
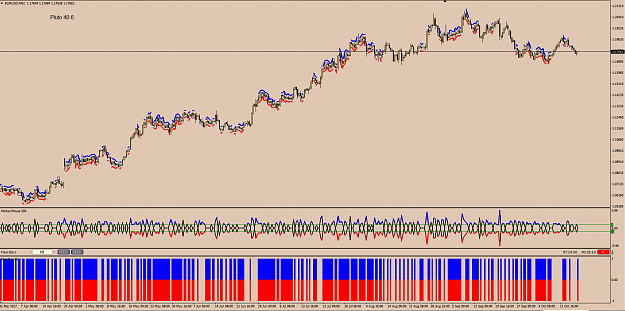
This attempt is quite complex. It envolves two wavelet transforms. The blue envelop is supposed to brace the PA. I expected it to widen when the market is choppier. The result is largely impacted by the lag making the price leak the band. I noticed that the sharp turning points are mistaken for high choppiness. The band also wrongly narrows when the market is choppy within a very small range (see 4/9 and 13/9) that is mistaken for a smooth "horizontal swing".
(I took the same PA as mambomango for comparison.)
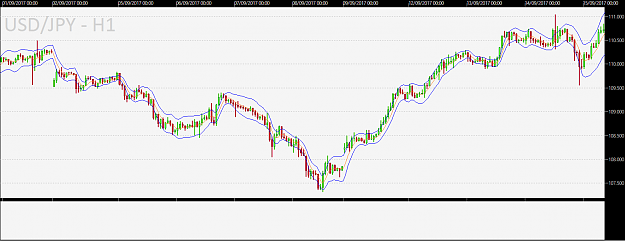
{image} Hi all. I'm sure you looked at the picture above. No doubt you immediately made a clear distinction between the left side and the right side. On the left the market is falling like a stone on the right the price is jumping all over the place: choppy. There were several attempts here in FF and at other places to build a "choppiness index" indicator. I found no successful results. I wonder if someone has good ideas about building an algorithm which is able to measure how choppy the market is. The motivation for not simply using my naked eyes...
Ignored
I know there is absolutely no interest in auction market analysis, however it does provide a non-linear solution..........
There is a huge difference between a tick volume profile and a tpo profile chart……….
A "price over time" TPO profile (frequency distribution) rather than volume of ticks allows, filters out the noise of the volume of ticks.
All we need to know that during a 30m segment of time that price was used. It doesn’t matter if the same price was quoted 15 times during that 30m segment of time it still counts as 1 tpo.
Frequency of price used over time Gives you a single multidimensional distribution/display of prices .
A frequency distribution of prices used over time, is a single "multidimensional" display of prices used over time therefore it's not biased by observer timeframe
By breaking the market into it's smallest components/units: TPO's... "price*time events", "time price opportunities", "time that price occurred" , all the same. You now have a data set that is quantifiable & measureable is unbiased by observer TF (objective data).
Not all distributions need be Gaussian (i.e…...frequency dist.)
auction market analysis in these examples each letter = 1 tpo
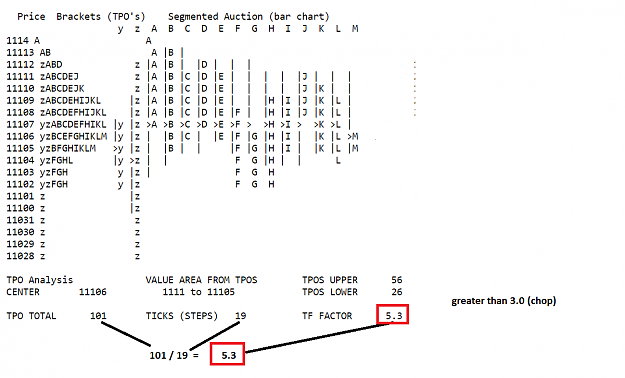
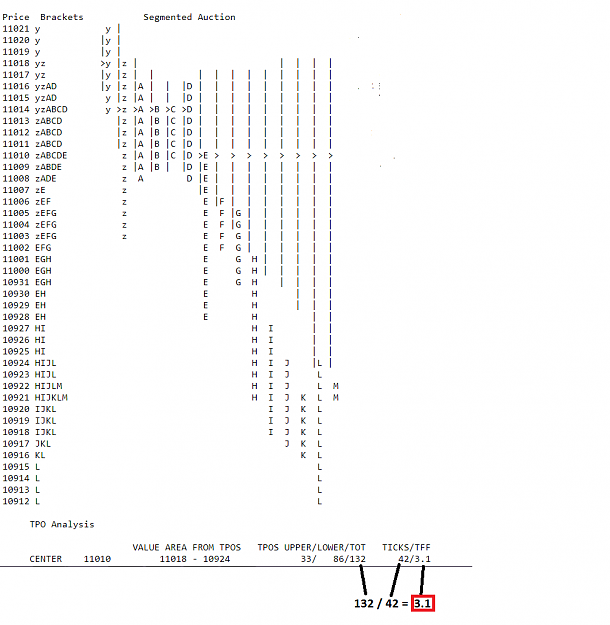
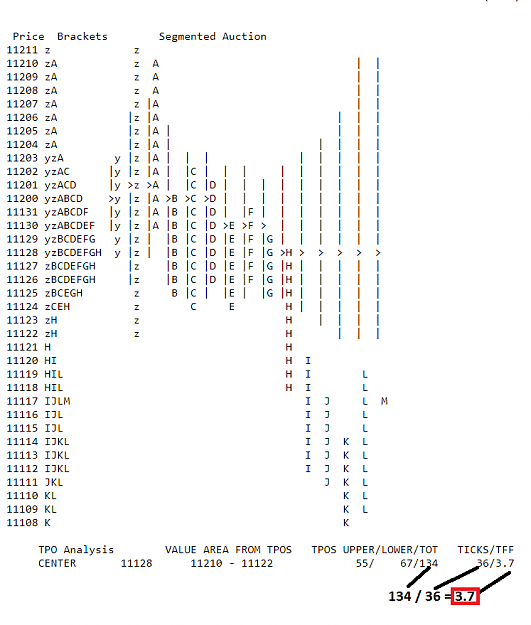
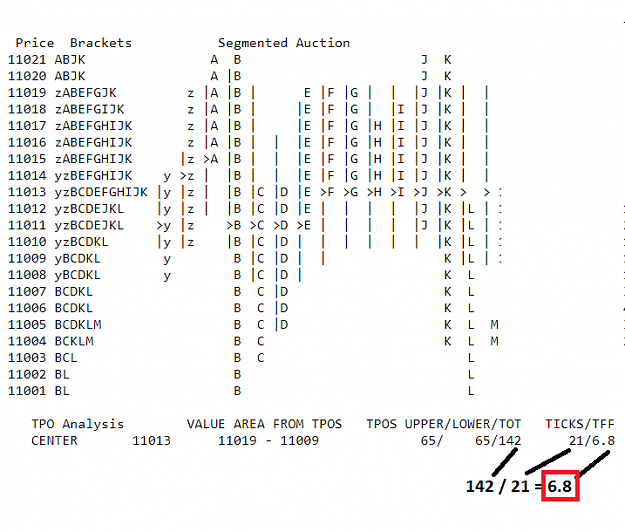
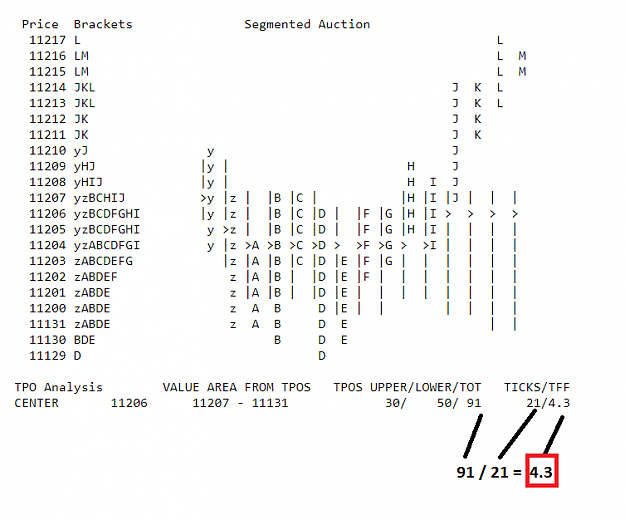
Total tpo's /divided by prices steps in auction market analysis = "trade facilitation factor" (TFF). It's a measure how well the tpo's are distributed at each price (frequency distribution) The greater num of tpo's distributed at each price, that means that price has been used more frequently over time. If price is frequently being used over time, revisiting the same prices over time, it means price is auctioning up & down "facilitating 2 way trade" what you might consider "choppiness" the greater the # of tpo's at each price, the greater the rotation of price/auctioning, 2 way trade. (choppiness)
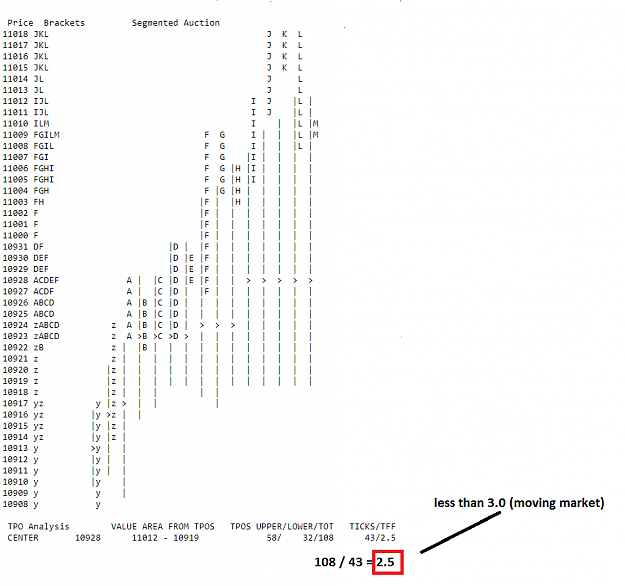
When there are 3 or fewer tpo's per price it tells you price didn't spend much time trading at those prices, if price spends little time trading at each price in the distribution it's a "moving" market/no longer auctioning up & down.
By breaking the market into it's smallest units: TPO's You now have a data set that is quantifiable & measureable……
You now have a measure of how well the market is facilitating trade. Is it auctioning up & down (choppy)? Or is it moving?. You can now monitor your data for changes. You can measure if it's increasing, or decreasing, by how much & to what degree
1.0 = 1 perfect trend. Greater than 3.0 it starts to slowly increase rotations. (Chop)
So the total "time price events", divided by price steps (ticks/price steps) = trade facilitation factor
That just scratches the surface of auction market analysis…….. Tpo's above and tpo's below the poc tells you if there is an imbalance of selling "time price opportunities" (tpo's) over buying "time price opportunities", it can give you a directional bias in what would be considered balanced conditions, etc...
Attached Image(s) (click to enlarge)
Markets are not efficient, rather they are effective - Jones
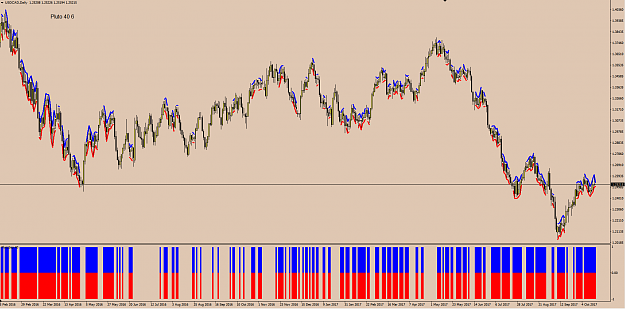
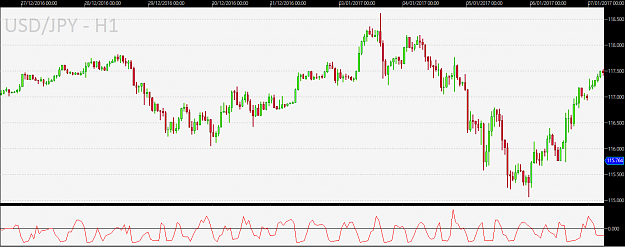
Thank you for posting this. This looks really what I'm after. I quickly coded an indi to see what it looks like. Unfortunately the result is deceptive because it is highly dependent on the value of the parameter r and it is hardly interpretable. I feel like the entropy is yet a good direction.
{quote} Thank you for posting this. This looks really what I'm after. I quickly coded an indi to see what it looks like. Unfortunately the result is deceptive because it is highly dependent on the value of the parameter r and it is hardly interpretable. I feel like the entropy is yet a good direction. {image}
Ignored
which exact formula did you used for the approximate entropy?
i want to measure the currencies themself.
I love choppy (ranging) market ... All I have to do is wait until it breaks a side then plan a trade going in that direction ...
Even during a trending market, my daily trading activity is identifying "strong" SR and wait for a side to be broken before planning anything ... (the breakout could be a continuation or a reversal)
"Buy high sell higher, Sell low buy lower" is another way to make money out of the market besides the "Buy low, Sell high" concept, although none is more superior than the other ... (there's the right time and place for everything) ...