Disliked{quote} Based on this distribution I came up with a simple expirement to prove markets are NOT (completely) RANDOM.Ignored
I randomly created 100000 candlesticks to check its validity.
Here is my R code. Hope my code is correct.
Inserted Code
myfun <- function(n, n_ran){

u_wicks <- bodys <- l_wicks <- numeric(n)

for (i in 1:n){

candle <- cumsum(rnorm(n_ran))

open <- candle[1]
close <- candle[n_ran]
high <- max(candle)
low <- min(candle)

co <- close - open

if (co>0){ u_wick <- high - close ; l_wick <- open - low }else{ u_wick <- high - open ; l_wick <- close - low }

body <- abs(co)

range <- high - low

u_wicks[i] <- u_wick/range
bodys[i] <- body/range
l_wicks[i] <- l_wick/range
}

return(rbind(u_wicks, bodys,l_wicks))
}

system.time(
res <- myfun(100000,100000)
)

c( upperwick=mean(res[1,]), body=mean(res[2,]), lowerwick=mean(res[3,]) )
And I got:
Inserted Code
> c( upperwick=mean(res[1,]), body=mean(res[2,]), lowerwick=mean(res[3,]) )
upperwick      body lowerwick
0.2679532 0.4638644 0.2681823
Then I tried same experiment with EURUSD data from 2001-11-28 to 2017-02-03.
Here is the result:
60-min
upperwick body lowerwick
0.2858465 0.4399183 0.2741930
240-min
upperwick body lowerwick
0.2826349 0.4366006 0.2807645
1440-min
upperwick body lowerwick
0.2652093 0.4599965 0.2747942
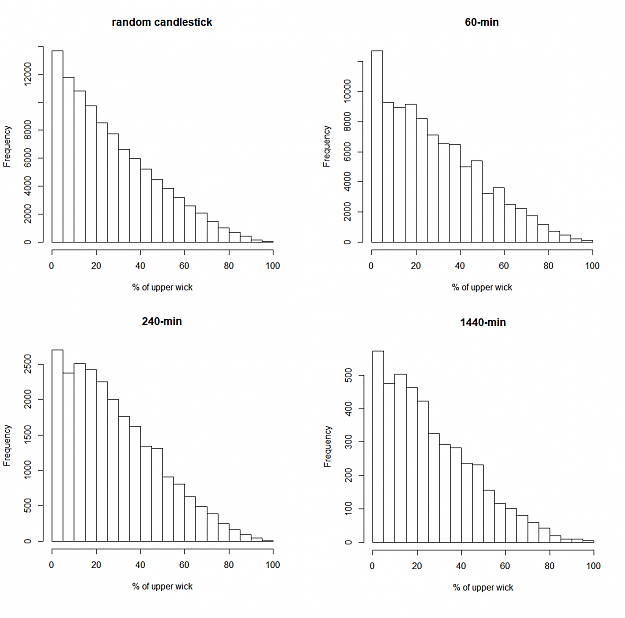
So actually the % is almost equal.
This is the frequency distribution of upper wick:
Attached Image (click to enlarge)
############################
Disliked{quote} The probability of price moving in the same direction that it previously moved is always greater than it traveling the opposite direction (This is a Market Law). This phenomenon is not easily observable when using standard time frames, however it can be seen using tick Data.Ignored
The distribution does not tell you about the directional bias. Actually it's completely opposite.
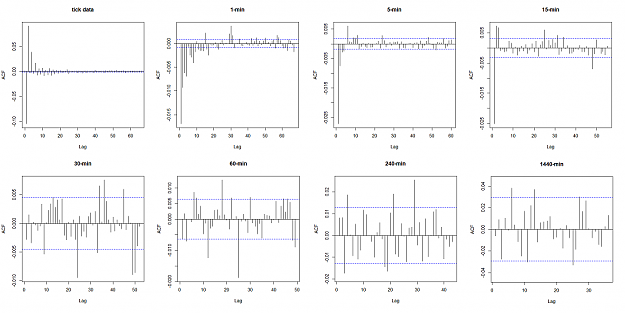
If you have studied high-frequency data, it is well known that the high-frequency data has 1st-order negative autocorrelation.
That means price has tendency to mean reversion.
And as the timeframe gets smaller, negative autocorrelation gets stronger.
I don't have tick data, so I downloaded EURUSD tick data from pepperstone.
Data period is 2016-11. (I am away from home so I cannot handle big data with my laptop)
This is the picture of autocorrelation:
Attached Image (click to enlarge)
Size of my tick data is 3912084, and Up-tick is 1907954 and Down-tick is 2004130.
the probability of Up-tick followed by Up-tick is about 42% (803266) and
the probability of Down-tick followed by Down-tick is about 45% (899442).
Or otherwise, If I trade with mean reversion strategy (buy after down-tick and sell after up-tick), the result would be:
Attached Image

surely trading cost will kill all the profit though.
So:
Disliked{quote} The answer was an approximate 3 points (0.3pips) of cost per trade is the maximum allowable cost IF a trader were to trade EVERY single tick that prints in a new direction and remain profitable.Ignored
"similar experiment" because I used mean reversion strategy.
You should be careful using the statistic.
Fat tail distribution tells you that the occurrence of big move is greater than normal distribution.
But as long as the distribution is symmetric and mean=0, you cannot say anything about directional bias.
You have to analyse the data as a sequence (time series).
edit: maybe this is what you are trying to say?
Maybe I am talking something different, so can you explain a bit deeper?
What data did you use and how did you come up with your statement?
Thank you,
16