EURUSD Daily pinbar. Another quick explanation how lower time frames can be helpful for managing trades, re-entering trades or getting in on trades you may have missed.
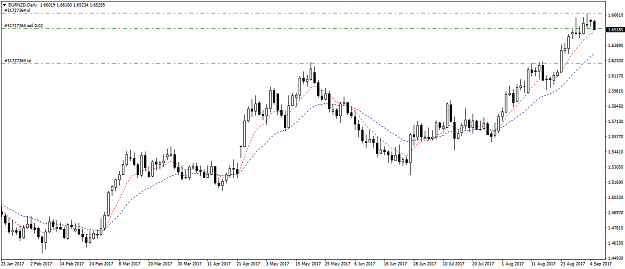
This is the Daily chart I posted on the 16th August with the areas I'm interested in marked. It's like adding a framework for taking and managing trades.

Then we had the Daily pinbar at the top line (with confluence), an obvious target is the next blue line down (a price flip zone).

You can manage the trade purely from watching the Daily chart and how price moves down, you need to plan where you're going to move your stop loss or take some profit etc.
What new traders do often is see price stall or reverse a little way and hit the panic button, close the trade or even widen the stop loss thinking price is going to turn on them but don't want to ditch the trade (yes, I've seen a lot of people do this).
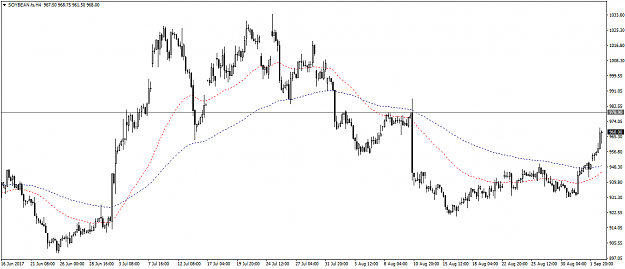
Here I've gone down to the 30 minute chart and marked with dotted lines areas where I would expect price to react, simple highs/ lows, flips etc and you can see price reacted at these levels, stalled or retraced a little way, but you knew there was a good chance that would happen so there's no need to panic. When price passes through these levels you could move your stop down or re enter (you still have the same target but you can use a much smaller stop loss, a great way to maximize your return).
As I've said before, sometimes these levels can turn price completely, nothing is certain. Try plotting these levels, it'll really help your confidence as well as improving your chart reading skills.
EURUSD 30 minute chart.

This is the Daily chart I posted on the 16th August with the areas I'm interested in marked. It's like adding a framework for taking and managing trades.
Attached Image (click to enlarge)
Then we had the Daily pinbar at the top line (with confluence), an obvious target is the next blue line down (a price flip zone).
Attached Image (click to enlarge)
You can manage the trade purely from watching the Daily chart and how price moves down, you need to plan where you're going to move your stop loss or take some profit etc.
What new traders do often is see price stall or reverse a little way and hit the panic button, close the trade or even widen the stop loss thinking price is going to turn on them but don't want to ditch the trade (yes, I've seen a lot of people do this).
Here I've gone down to the 30 minute chart and marked with dotted lines areas where I would expect price to react, simple highs/ lows, flips etc and you can see price reacted at these levels, stalled or retraced a little way, but you knew there was a good chance that would happen so there's no need to panic. When price passes through these levels you could move your stop down or re enter (you still have the same target but you can use a much smaller stop loss, a great way to maximize your return).
As I've said before, sometimes these levels can turn price completely, nothing is certain. Try plotting these levels, it'll really help your confidence as well as improving your chart reading skills.
EURUSD 30 minute chart.
Attached Image (click to enlarge)
2