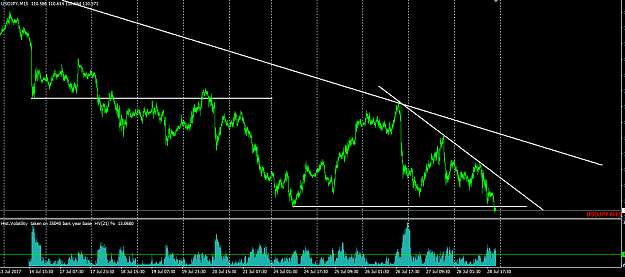
Does anyone know of a volatility indicator that shows past volatility history vs current volatility. I.E. last x number of weeks/hours vs current
Ignored
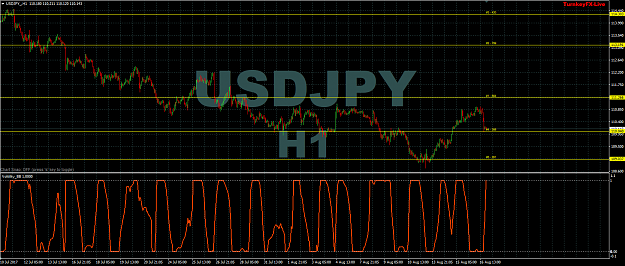
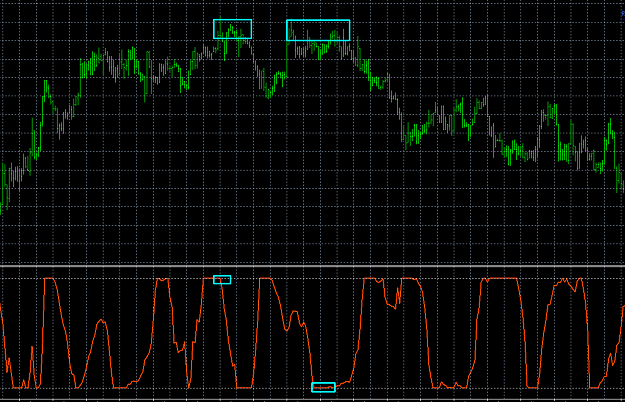
This seemed like an interesting concept so I made this indicator. It works by comparing the current width of the bollinger bands to the past n periods width. The scale ranges from 0-100%.
0%- means the the bands are currently the most narrow of the past n periods, and therefore volatility is low/er.
100% - means the bands are currently at the widest in the past n periods, and therefore volatility is high/er.
{quote} This seemed like an interesting concept so I made this indicator. It works by comparing the current width of the bollinger bands to the past n periods width. The scale ranges from 0-100%. 0%- means the the bands are currently the most narrow of the past n periods, and therefore volatility is low/er. 100% - means the bands are currently at the widest in the past n periods, and therefore volatility is high/er. {image} {file}
Ignored
thanks not quite what i was thinking but will try it.
{quote} This seemed like an interesting concept so I made this indicator. It works by comparing the current width of the bollinger bands to the past n periods width. The scale ranges from 0-100%. 0%- means the the bands are currently the most narrow of the past n periods, and therefore volatility is low/er. 100% - means the bands are currently at the widest in the past n periods, and therefore volatility is high/er. {image} {file}
{quote} ,,,, I made this indicator. It works by comparing the current width of the bollinger bands to the past n periods width. The scale ranges from 0-100%. 0%- means the the bands are currently the most narrow of the past n periods, and therefore volatility is low/er. 100% - means the bands are currently at the widest in the past n periods, and therefore volatility is high/er.
Ignored
Thanks Nicholishen. Made a template up just now
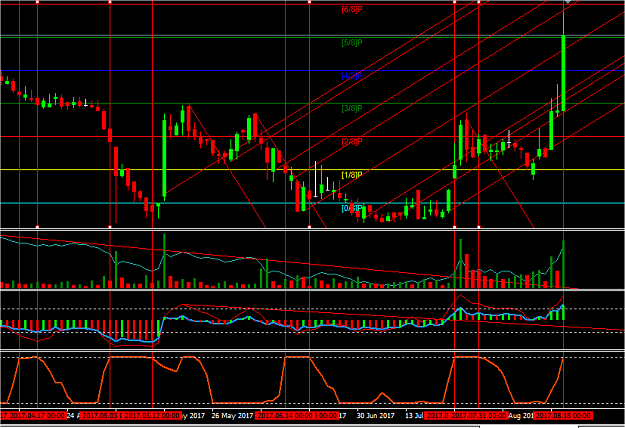
Also you for your very illustrative charts Juhamini.
"You know what needs to be addressed , completely completely reverse that".
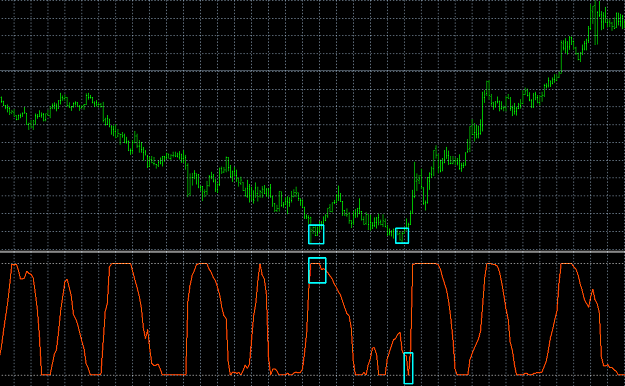
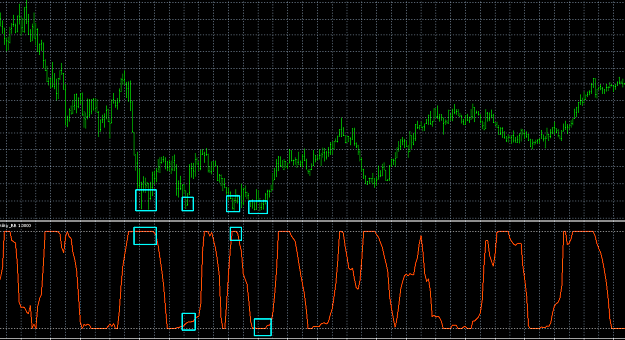
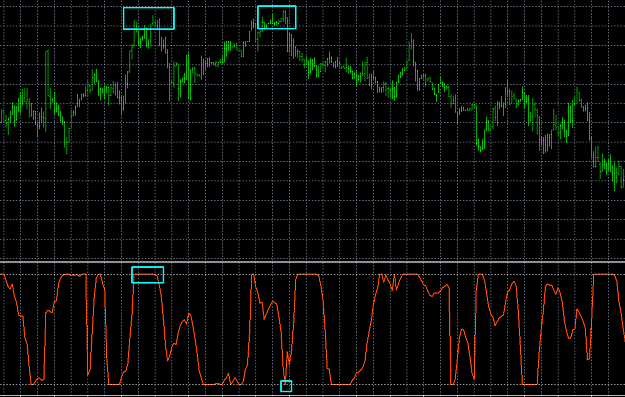
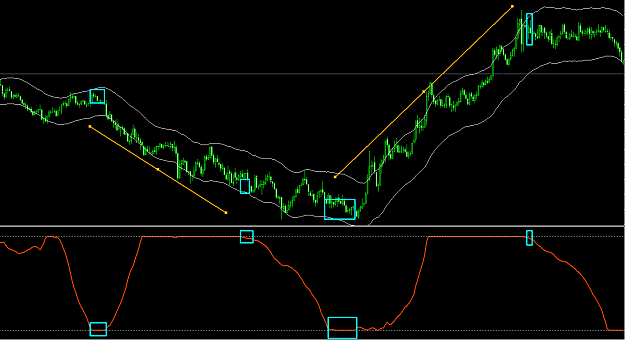
I'm quite surprised at the "SETUPS" you discovered and displayed which I understood perfectly. A pair of volatility strength and expiry/exhaustion in a double bottom or double top structure.
Are you still trading the setup now; it appears like a kind that defies time or market conditions..??