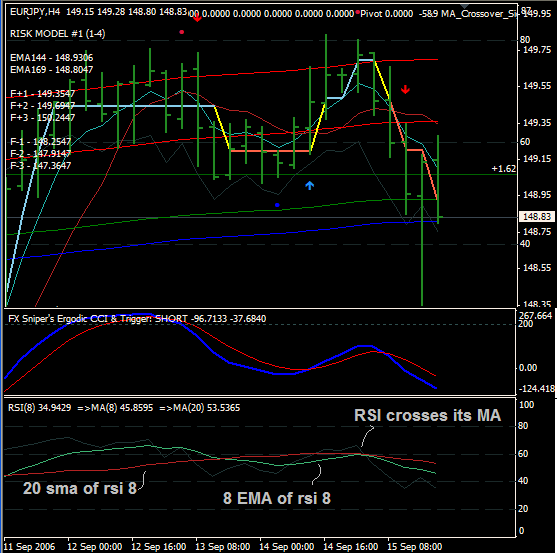
Ok. I did just what you said:
I put up a pane of RSI 8.
Then, I used 2 moving averages:
1. 8 EMA of the RSI
2. 20 SMA of the RSI.
Here is a picture of the EURJPY:
I see the most recent down move had a red silvertrend dot. That dot coincides with the exact crossing of the RSI and its 8 EMA.
Am I on the right track?
Love to hear more about it.
Quoting taxgeekDislikedI found this in another forum. It was originally created by Accrete. It works really well with Tlatomi. Put RSI(8) on your chart. Then the 8 period exponential moving average of RSI(8) (just drag the moving average from the navigator into the RSI pane and choose apply to first indicator from the drop down box.). Then follow the same method to put in the 20 period simple moving average of RSI(8). Look for the times when the RSI(8) crosses the 8 period moving average of RSI(8) or just look for the SHI Silvertrends and then look at the RSI. You'll find that if the Silvertrend signal is accurate, that RSI will also cross it's moving average. This happens almost at the same time as the Silvertrend appears. I can see where this could be used as a replacement for the notoriously repainting SHI or as a replacement for the 5-9 cross or a supplement to both. It happens much sooner than the 5-9 and pretty much coincides with the FX Sniper cross. On one particular Tlatomi trade on the EUR 4 hr, it would have gotten in 50 pips sooner than the 5-9 ( the 5-9 trade turned out to be a loser). Best longs are taken from crosses below the 20 period avg and shorts from above. Thought you guys might like to take a look at this.Ignored
Attached Image