Markus,
thanks for your reply.
I know that a discussion will not bring any "result" for both of us. So, please have a look at the following charts to understand my point of view with regard to the count of daneric.
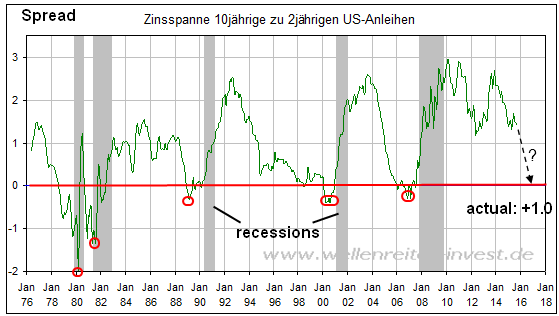
The stock crash indicator shows that a top in the stock market will not come this year - the spread of the T-Notes must be negative as in all crashes since 1975.
Yesterdays value was (plus) +0,9.
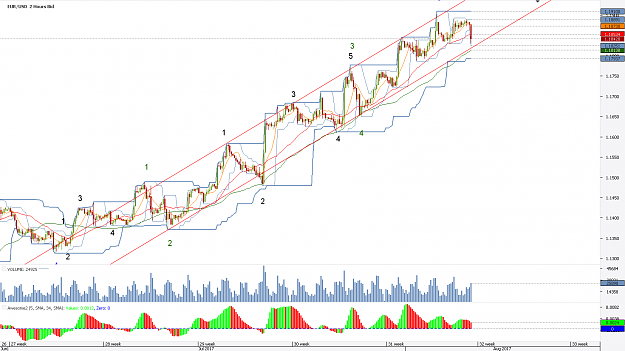
The actual pattern of the S&P 500 is a irregular flat as in 2009 and 2013.
Sixer
thanks for your reply.
I know that a discussion will not bring any "result" for both of us. So, please have a look at the following charts to understand my point of view with regard to the count of daneric.
The stock crash indicator shows that a top in the stock market will not come this year - the spread of the T-Notes must be negative as in all crashes since 1975.
Yesterdays value was (plus) +0,9.
The actual pattern of the S&P 500 is a irregular flat as in 2009 and 2013.
Sixer
Attached Image(s) (click to enlarge)