I am beginning this thread to explore a dashboard I have been working on and am hoping others will try it out and give their suggestions too.
DISCLAIMER: I am a rookie trader (about 9 months experience) and I am a rookie coder, self taught. So use this dash in a fake account and AT YOUR OWN RISK!!!!!!! I also want to thank GVC, since I started with his dash skeleton.
My friend at work, ray(he got me into forex) and I, after trying out a various indies, webinars, websites, etc, got to talking about a strategy and came up with this KISS(keep it simple stupid!) dashboard. Everytime I want to code something fancy for 1 occurrence or another, I remind myself to KISS!!!!
The basis of this dashboard is the moving averages, 7 and 21, and how they relate to each other.
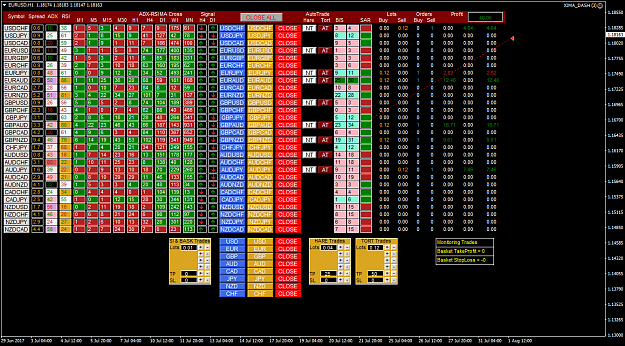
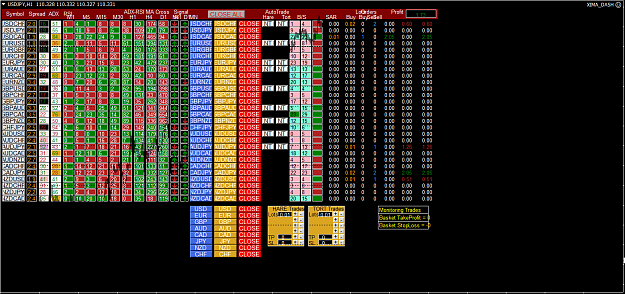
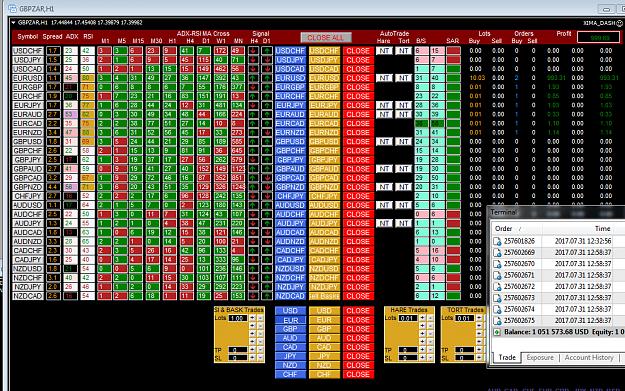
So this is how it works, going thru the columns, left to right:
Column 1: the 28 pairs listed. If you click a pair here, you will open a chart of that pair. If you want to use your own template, use the name XIMA_DASH_T.tpl and your template will be used. Otherwise, I guess it is the default that comes up.
Column 2: the spread for the pair..self explanatory
Column 3: the ADX for the pair..taken on the 3o MIN TF. The Average Directional Index shows the strength of a trend.not the direction.
Column 4: the RSI for the pair.taken on the 30 MIN TF.
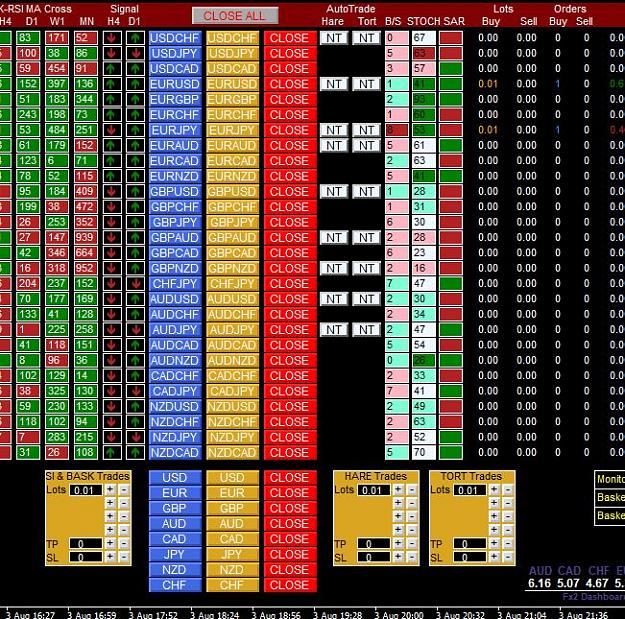
Time Frame Columns: these show the distance between the 7 and 21 Moving Averages on each TF. If the color of the square is green, the 7 is above the 21. Red color for 7 below the 21.
Signal Squares-H4 & D1: these I left in from GVCs original dash. This is an average of the daily his and lows compared to the 12 MA on the 4 hour and day TFs and gives and up or down arrow.
Center Pair Columns(3): these buttons allow for 1 click trading for each pair. The blue is buy, gold is sell and red is close the 1 click trade for that pair.
Center Pair Grouping at Bottom of Dash: these buttons allow for 1 click trading for the whole basket of a currency. So if you click the blue USD, you will buy all the pairs with USD as the primary currency and you will also sell all the pairs with the USD as the second currency. The opposite will happen if you click the Gold USD button. This is a sell for Primary USD pairs and a buy for seconday USD pairs.
Auto Trading HARE & Tortoise Columns: These are the auto trading buttons. Light Gray color (NT) means no auto trading for that pair. Dark Maroon color (AT) means auto trading is turned on for that pair.
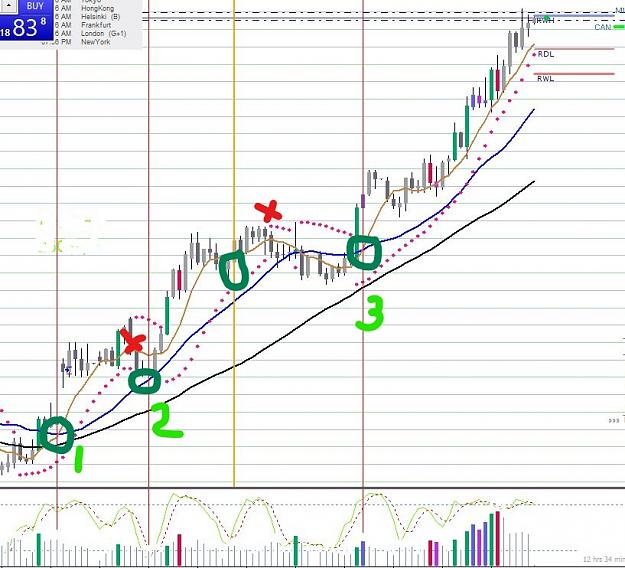
HARE button (riskier trade) will made a BUY trade when: the 7 MA is above the 21 MA and the SAR is below the current candle on the 1HR TF.
HARE button (riskier trade) will made a SELL trade when: the 7 MA is below the 21 MA and the SAR is above the current candle on the 1HR TF.
TORTOISE button (conservative trade) will made a BUY trade when: the 7 MA is above the 21 MA AND the 21 MA is above the 49 MA and the SAR is below the current candle on the 1HR TF. *
TORTOISE button (conservative trade) will made a SELL trade when: the 7 MA is below the 21 MA AND the 21 MA is above the 49 MA and the SAR is above the current candle on the 1HR TF. *
*You can set your lot size, take profit and stop loss using the inputs below labeled accordingly. The SL and TP is increased or decreased by 5 with each click. The lot size is set using the set of 4 +/- buttons, each set increases or decreases a certain digit. (I set it up this way so we do not have to click 100s of times to set the digits in front of the decimal!). All auto trading will use these inputs for all corresponding trades.
In theory, we will get surer, less risky trades using the TORTOISE button.
Note: SAR is the Stop and Reverse indicator.
B/S Column: This was originally meant to be used for a Buy/Sell Signal of the strongest trending pair. I dont really pay much attention to it now, but it shows the distance between the 7 and 21 MAs on the 30 MIN TF. So the pair with the largest number in it is currently trending the most (in theory). The pair that is highlighted by a dark green or dark maroon color, is the best trending pair.
You will notice 3 yellow input boxes. The Left box is for Single trades (the blue and yellow buttons down the center). This box does not work for the Baskets, although the Lot value will work with the Baskets buttons, just not the SL and TP.
The 2nd and 3rd yellow input box are for setting values for the Hare Auto Trading function and Tortoise Auto Trading function. They all work the same. Use the + and – buttons for increasing/decreasing the values. 4 + & - buttons control your lots, because each one corresponds to a digit. (I didn’t want to click tons of times for higher lots!). Try it, you will figure it out!
I’m still working on the Time setting......
Green Pips to us All!!!
Here is the latest file. I hope people will try this out and post their results!
FYI....sometimes you might press a trade button and it does not work. look at your Journal tab and see the error. sometimes, esp with trades involving JPY, your SL and TP's might be too small for the trade to be placed. so watch for that!!
DISCLAIMER: I am a rookie trader (about 9 months experience) and I am a rookie coder, self taught. So use this dash in a fake account and AT YOUR OWN RISK!!!!!!! I also want to thank GVC, since I started with his dash skeleton.
My friend at work, ray(he got me into forex) and I, after trying out a various indies, webinars, websites, etc, got to talking about a strategy and came up with this KISS(keep it simple stupid!) dashboard. Everytime I want to code something fancy for 1 occurrence or another, I remind myself to KISS!!!!
The basis of this dashboard is the moving averages, 7 and 21, and how they relate to each other.
So this is how it works, going thru the columns, left to right:
Column 1: the 28 pairs listed. If you click a pair here, you will open a chart of that pair. If you want to use your own template, use the name XIMA_DASH_T.tpl and your template will be used. Otherwise, I guess it is the default that comes up.
Column 2: the spread for the pair..self explanatory
Column 3: the ADX for the pair..taken on the 3o MIN TF. The Average Directional Index shows the strength of a trend.not the direction.
Column 4: the RSI for the pair.taken on the 30 MIN TF.
Time Frame Columns: these show the distance between the 7 and 21 Moving Averages on each TF. If the color of the square is green, the 7 is above the 21. Red color for 7 below the 21.
Signal Squares-H4 & D1: these I left in from GVCs original dash. This is an average of the daily his and lows compared to the 12 MA on the 4 hour and day TFs and gives and up or down arrow.
Center Pair Columns(3): these buttons allow for 1 click trading for each pair. The blue is buy, gold is sell and red is close the 1 click trade for that pair.
Center Pair Grouping at Bottom of Dash: these buttons allow for 1 click trading for the whole basket of a currency. So if you click the blue USD, you will buy all the pairs with USD as the primary currency and you will also sell all the pairs with the USD as the second currency. The opposite will happen if you click the Gold USD button. This is a sell for Primary USD pairs and a buy for seconday USD pairs.
Auto Trading HARE & Tortoise Columns: These are the auto trading buttons. Light Gray color (NT) means no auto trading for that pair. Dark Maroon color (AT) means auto trading is turned on for that pair.
HARE button (riskier trade) will made a BUY trade when: the 7 MA is above the 21 MA and the SAR is below the current candle on the 1HR TF.
HARE button (riskier trade) will made a SELL trade when: the 7 MA is below the 21 MA and the SAR is above the current candle on the 1HR TF.
TORTOISE button (conservative trade) will made a BUY trade when: the 7 MA is above the 21 MA AND the 21 MA is above the 49 MA and the SAR is below the current candle on the 1HR TF. *
TORTOISE button (conservative trade) will made a SELL trade when: the 7 MA is below the 21 MA AND the 21 MA is above the 49 MA and the SAR is above the current candle on the 1HR TF. *
*You can set your lot size, take profit and stop loss using the inputs below labeled accordingly. The SL and TP is increased or decreased by 5 with each click. The lot size is set using the set of 4 +/- buttons, each set increases or decreases a certain digit. (I set it up this way so we do not have to click 100s of times to set the digits in front of the decimal!). All auto trading will use these inputs for all corresponding trades.
In theory, we will get surer, less risky trades using the TORTOISE button.
Note: SAR is the Stop and Reverse indicator.
B/S Column: This was originally meant to be used for a Buy/Sell Signal of the strongest trending pair. I dont really pay much attention to it now, but it shows the distance between the 7 and 21 MAs on the 30 MIN TF. So the pair with the largest number in it is currently trending the most (in theory). The pair that is highlighted by a dark green or dark maroon color, is the best trending pair.
You will notice 3 yellow input boxes. The Left box is for Single trades (the blue and yellow buttons down the center). This box does not work for the Baskets, although the Lot value will work with the Baskets buttons, just not the SL and TP.
The 2nd and 3rd yellow input box are for setting values for the Hare Auto Trading function and Tortoise Auto Trading function. They all work the same. Use the + and – buttons for increasing/decreasing the values. 4 + & - buttons control your lots, because each one corresponds to a digit. (I didn’t want to click tons of times for higher lots!). Try it, you will figure it out!
I’m still working on the Time setting......
Green Pips to us All!!!
Here is the latest file. I hope people will try this out and post their results!
FYI....sometimes you might press a trade button and it does not work. look at your Journal tab and see the error. sometimes, esp with trades involving JPY, your SL and TP's might be too small for the trade to be placed. so watch for that!!
Attached Image (click to enlarge)
Attached File(s)
Mother of Pips