Can anyone verify which chart is correct?
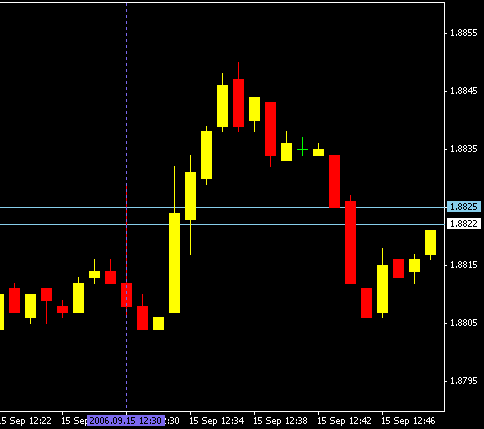
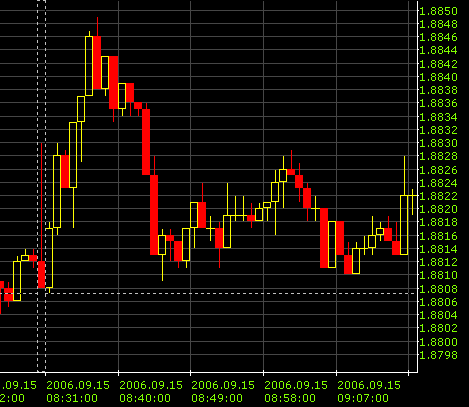
I swear IBFX chart is erroneous.. Candle for 8:31 and 8:32 time are bearish over at IBFX but over at FXCM, its bullish!
IBFX chart has no Grid; FXCM chart has grid (2nd attachment)
I swear IBFX chart is erroneous.. Candle for 8:31 and 8:32 time are bearish over at IBFX but over at FXCM, its bullish!
IBFX chart has no Grid; FXCM chart has grid (2nd attachment)
Attached Images