Hey guys,
Just updating my results from post 7088. Again this'll be a long post so apologies in advance. I'll only be reporting on Daily trading results as I still only have 2 weeks worth of data. The patterns observed in the 1st week have been pretty consistent over the second week which is a good thing as that means that the entry and exit times remain valid even with a larger data set.
In addition to baskets 1-3 I've included a 4th basket with reversed signals for the 1st basket which opens at different times. I know this goes against the 1st post but bear with me and you'll understand why I've made this decision even though it seems rather counter-intuitive at first sight. So into the result...
My current settings are:
Basket 1: TF Lv2 1440 17:30 - 19:30*
Basket 2: TF Lv2 10080 10:40 - 14:45
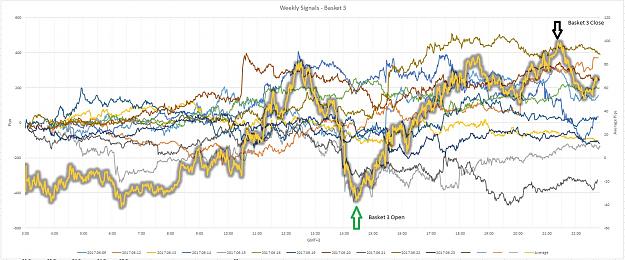
Basket 3: TF Lv2 43200 14:30 - 21:30
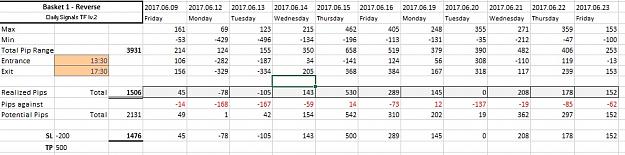
Basket 4: TF Lv2 1440 reversed 13:30 - 17:30
*all times are GMT+3
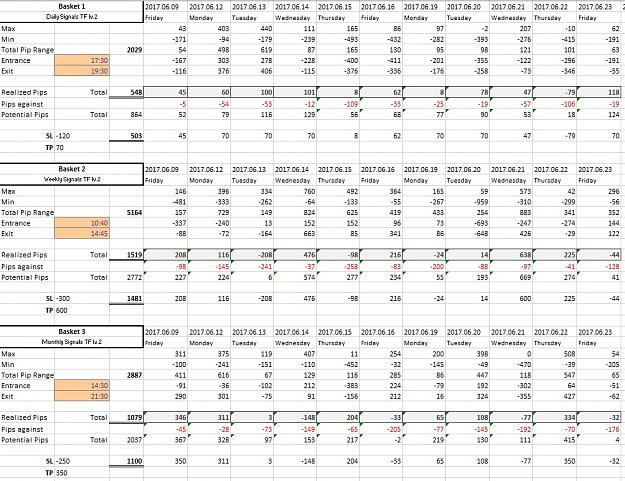
For those interest in the drawdown and potential pips for each trade. Good to look at to see how risky each basket is. Now for some charts.
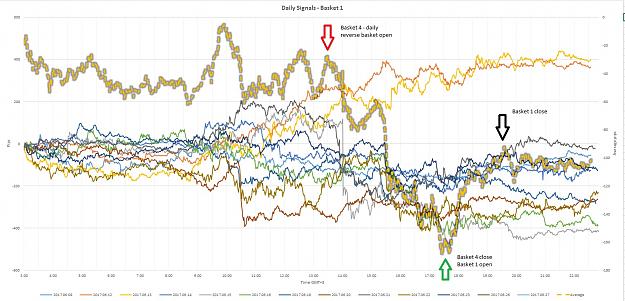
So this is why I've decided to reverse the daily signals as there is quite a large drop between 13:30-17:30 that gives better results than any other period in the non reverse. It is possible to enter the reverse signals earlier when the average is higher for larger gains however this will also increase the time frame that these trades remain open and consequently, a larger drawdown is observable which I want to try to minimize.
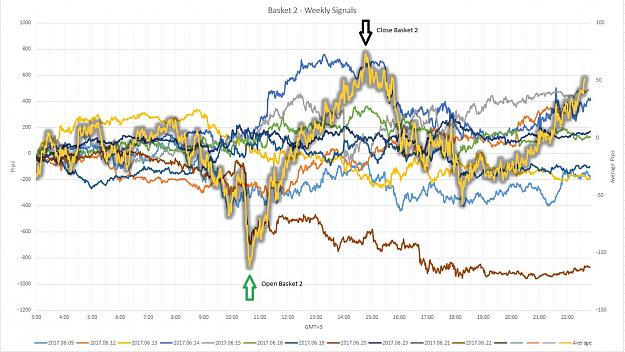
Pretty self explanatory I think. Enter when the average is lowest and exit when it is higher. You could potentially enter and exit two times throughout the day when the average decreases over the london session and then enter again after NY open to close just before NY close. Might even reduce losses. Again, something I might decide to take a look at once I have a larger data set.
Again as above, basket can also be run in an earlier session as well. Will have a look at one more data is available.
So far, the trends for opening and closing times seem pretty consistent which kind of surprised me and the results just seem too good to be true.
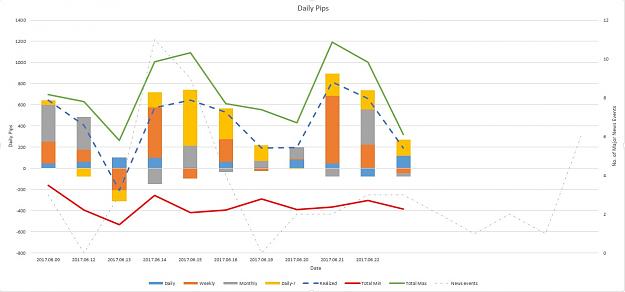
The combination of all 4 baskets with varying signal time frames seem to produce a great combination, further diversifying risk and with the determined trading timeframes increasing the probability of winning trades on our side. Where one basket failed, another basket seemed to give us the pips while very little realized losses were evident. The below chart shows this where the colors indicate which basket the pips were made. The max and minimum is simply the addition of the maximum possible pips that can be lost and made during the opening and closing times of all the baskets. I've also included the no. of news events with 3 bulls from investing.com for each day to see the influence of news on results.
I ran a simulation with starting capital of $500 on the current settings increasing lot size when margin % of account was greater than 500% and after the 11 days trading, the account grew to $1900. Max floating drawdown was about 15% with average of about 8%. Yes, unrealistic and very aggressive trading but if future results remain consistent, this is going to be very profitable. I was expecting a lot more variability in results even in a small 2 week timeframe. Now lets see how next week will fare with these settings.
Again, my demo broker for the mini account I opened doesn't do all the pairs that are reccomended by the CCFp indicator. something to keep in mind.
David
Just updating my results from post 7088. Again this'll be a long post so apologies in advance. I'll only be reporting on Daily trading results as I still only have 2 weeks worth of data. The patterns observed in the 1st week have been pretty consistent over the second week which is a good thing as that means that the entry and exit times remain valid even with a larger data set.
In addition to baskets 1-3 I've included a 4th basket with reversed signals for the 1st basket which opens at different times. I know this goes against the 1st post but bear with me and you'll understand why I've made this decision even though it seems rather counter-intuitive at first sight. So into the result...
My current settings are:
Basket 1: TF Lv2 1440 17:30 - 19:30*
Basket 2: TF Lv2 10080 10:40 - 14:45
Basket 3: TF Lv2 43200 14:30 - 21:30
Basket 4: TF Lv2 1440 reversed 13:30 - 17:30
*all times are GMT+3
Attached Image (click to enlarge)
Attached Image (click to enlarge)
For those interest in the drawdown and potential pips for each trade. Good to look at to see how risky each basket is. Now for some charts.
Attached Image (click to enlarge)
So this is why I've decided to reverse the daily signals as there is quite a large drop between 13:30-17:30 that gives better results than any other period in the non reverse. It is possible to enter the reverse signals earlier when the average is higher for larger gains however this will also increase the time frame that these trades remain open and consequently, a larger drawdown is observable which I want to try to minimize.
Attached Image (click to enlarge)
Pretty self explanatory I think. Enter when the average is lowest and exit when it is higher. You could potentially enter and exit two times throughout the day when the average decreases over the london session and then enter again after NY open to close just before NY close. Might even reduce losses. Again, something I might decide to take a look at once I have a larger data set.
Attached Image (click to enlarge)
Again as above, basket can also be run in an earlier session as well. Will have a look at one more data is available.
So far, the trends for opening and closing times seem pretty consistent which kind of surprised me and the results just seem too good to be true.
The combination of all 4 baskets with varying signal time frames seem to produce a great combination, further diversifying risk and with the determined trading timeframes increasing the probability of winning trades on our side. Where one basket failed, another basket seemed to give us the pips while very little realized losses were evident. The below chart shows this where the colors indicate which basket the pips were made. The max and minimum is simply the addition of the maximum possible pips that can be lost and made during the opening and closing times of all the baskets. I've also included the no. of news events with 3 bulls from investing.com for each day to see the influence of news on results.
Attached Image (click to enlarge)
I ran a simulation with starting capital of $500 on the current settings increasing lot size when margin % of account was greater than 500% and after the 11 days trading, the account grew to $1900. Max floating drawdown was about 15% with average of about 8%. Yes, unrealistic and very aggressive trading but if future results remain consistent, this is going to be very profitable. I was expecting a lot more variability in results even in a small 2 week timeframe. Now lets see how next week will fare with these settings.
Again, my demo broker for the mini account I opened doesn't do all the pairs that are reccomended by the CCFp indicator. something to keep in mind.
David
13