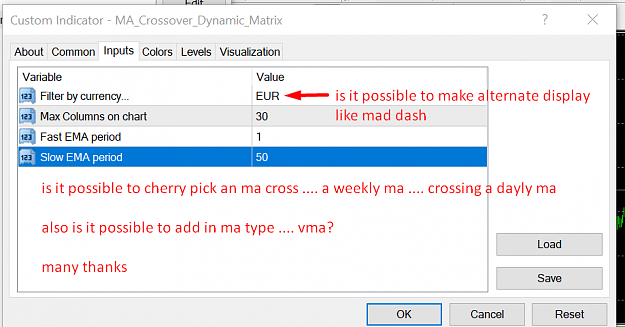
I've been messing around with a new framework I've been working on to create dynamic matrices in the indicator sub-window. Here's my first experiment --a simple MA cross-over matrix that quickly swaps filters and changes the chart to the symbol and time-frame when clicked.
Features:
Displays a matrix of Pairs and time-frames filtered and grouped my each currency; changes to the corresponding chart of the symbol and time-frame clicked.
*Click on image to watch gif
Rotates filter by pressing the "m" key on keyboard.
*Click on image to watch gif

Dynamically resizes to the chart window.
*Click on image to watch gif
The brighter colors indicate a cross-over in the past 5 periods.
This is just a beta test... I may or may not provide support...
DOWNLOAD <--Most recent version available on my bitbucket repo(*Save in Indicators folder)
Features:
Displays a matrix of Pairs and time-frames filtered and grouped my each currency; changes to the corresponding chart of the symbol and time-frame clicked.
*Click on image to watch gif
Attached Image (click to enlarge)
Rotates filter by pressing the "m" key on keyboard.
*Click on image to watch gif
Attached Image
Dynamically resizes to the chart window.
*Click on image to watch gif
Attached Image (click to enlarge)
The brighter colors indicate a cross-over in the past 5 periods.
This is just a beta test... I may or may not provide support...
DOWNLOAD <--Most recent version available on my bitbucket repo(*Save in Indicators folder)
Attached File(s)