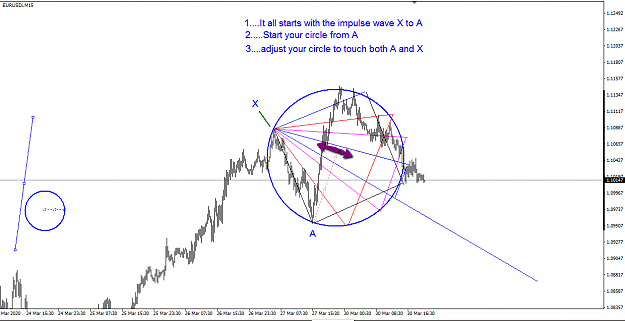
{quote} hi Swede: Simply Amazing. Currently Trying to figure out your entries and angles. can you have a look at this current Chart with a Circle? R we close to a Support Zone? {image}
Ignored
Circle setting below.....the angels from top to bottom starting at X are 15, 26,38,52,64,75 within the square......the impulse wave is the key..the square is drawn simply with 90 degree offset from the impulse wave...simple.....but take a ton of time to do this everytime in mt4..
{quote} Circle setting below.....the angels from top to bottom starting at X are 15, 26,38,52,64,75 within the square......the impulse wave is the key..the square is drawn simply with 90 degree offset from the impulse wave...simple.....but take a ton of time to do this everytime in mt4.. {image}
There are many ways to analyse a chart but when it comes to Gann methods there are two ways , equally effective if you have the right charts. And that is a big IF.
Diagonal Market Geometry
What I mean is drawing Becks Emblem is tedious...I would sooner not trade rather than having to do that every day in MT4. I am doing experiments for my own personal satisfaction to see if it really works for me...but just drawing the Emblem is NOT Enough to make decisions. Eg...is the 52 above or below X...if above and your thinking short you are not doing it according to the method perfected by Beck. If you dont have the quadrilateral to scale your chart and determine potential levels, again your breaking his method. If price breaks out of the circle all bets are off...did you know that? Or, if a Gartely pattern is not present then no trade is entered.... So while the emblem is neat...its not the holy grail by any means. Now,if you have Optuma with the Emblem and the plug in for the quadrilateral, well now you have something.
Horizontal Market Geometry
The study of levels is much more effective as practiced both by Beck and Jenkins if you only have mt4. Octave levels that are simple to draw offer very effective support or resistance in many instances. Or the Square root method can also be used to find these levels, Basic angles like the 90, 52 can be drawn quite effectively also..not perfect but guess what...they are not perfect with the pro charts either.....Using the square the square method by Jenkins can offer some absolutly outstanding entries, precise, clean, low draw down entries.
What im trying to say is dont get hung up thinking the Emblem or some other thing is the answer to trading effectively. Just a simple circle after an impulswave can give one great entries, just that only. So, please, if you only have mt4, use what works and that is the Horizontal drawings, the Diagonal methods will drive you to an early grave imho. Its very very difficult to find precision with mt4 if your trying to find the exact and perfect degree angles...
There are many ways to analyse a chart but when it comes to Gann methods there are two ways , equally effective if you have the right charts. And that is a big IF. Diagonal Market Geometry What I mean is drawing Becks Emblem is tedious...I would sooner not trade rather than having to do that every day in MT4. I am doing experiments for my own personal satisfaction to see if it really works for me...but just drawing the Emblem is NOT Enough to make decisions. Eg...is the 52 above or below X...if above and your thinking short you are not doing it...
Ignored
Your take on it is spotless...
You NEVER will be the person you could be, without pressure & discipline
For me simple price action, with JSA is doing wonders.
Hardly takes 1 min to draw JSA in trading view, if price is above box look for longs at support of angles, price bellow box short at angle resistance.
{quote} Leah.cim, I may be wrong but think what you asking are the Mathematical calculations derived from German mathematician Johannes Kepler. The How and Why I can't give you. In some advanced charting softwares I have seen your given a choice to use Kepler or Fibonacci ratios. A little light Gann reading (click link below photo) DM {image} {image}
Ignored
DiamondMiner. I have Kepler in my reading list but it will be a while before I get to him. Thanks for ur reply!
For me simple price action, with JSA is doing wonders. Hardly takes 1 min to draw JSA in trading view, if price is above box look for longs at support of angles, price bellow box short at angle resistance.
Ignored
Totally agree...and that would fall under the Horizontal Market Geopmetry...easy to see, simple to enter, only a few rules to pay attention too...good post!
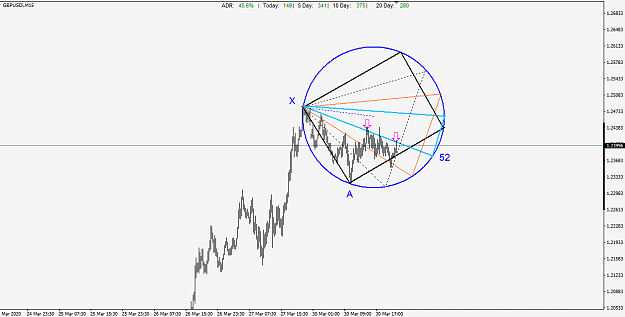
Here is one that fits the criteria GBPUSD Im short from the last arrow..its up 20 pips atm stop is at break even {image}
Ignored
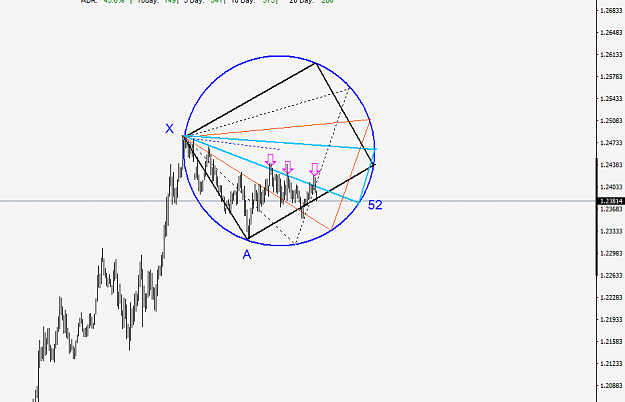
Just a few minutes ago the 52 was tested for the forth time...and proceeded to drop 30 pips in minutes....I was within 2 pips of being stopped out but wanted to show the update...
There are many ways to analyse a chart but when it comes to Gann methods there are two ways , equally effective if you have the right charts. And that is a big IF. Diagonal Market Geometry What I mean is drawing Becks Emblem is tedious...I would sooner not trade rather than having to do that every day in MT4. I am doing experiments for my own personal satisfaction to see if it really works for me...but just drawing the Emblem is NOT Enough to make decisions. Eg...is the 52 above or below X...if above and your thinking short you are not doing it...
Ignored
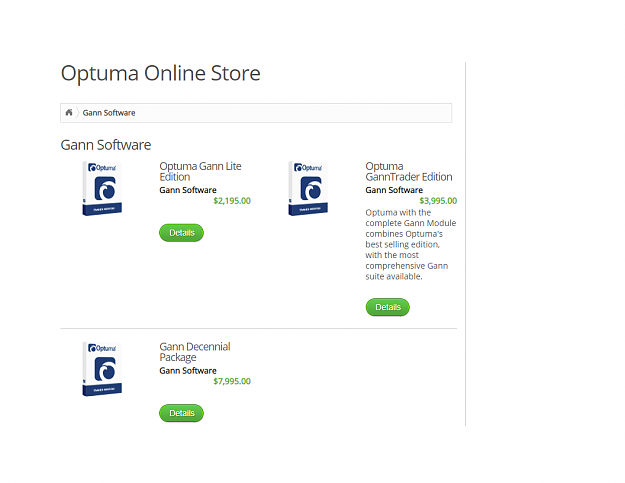
Swede, with Optuma, the Quadrilateral is standard, It's the Beck pkg that cost $500, Jenkins pkg cost $500 and Gann pkgs cost from $2,195 to $7,995
Attached Image (click to enlarge)
Included in one Gann pkg are these tools. Division of 3rds
Division of 8ths
Dynamic Gann Fan Angles
Dynamic Gann Levels
Dynamic Hex Intervals
Dynamic Square of 9
Gann Box
Gann Day Counts
Gann Fan Angles
Gann Mass Pressure
Gann Measured Degree Line
Gann Single Degree Line
Gann Square Markers
Gann Square Range
Gann Square Range Angle
Gann Square Range Marker
Gann Square Swing Markers
Gann Square Tools - Square Division Properties
Gann Square Top/Bottom
Gann Squares
Gann's Pattern of Vibration
High/Low Degree Angles
Number Searcher
Overlay Tool
Pattern Matcher
Price Division
Price Units, Factors, and Harmonics for Gann Tools
Pyrapoint
Seven Times The Base
Square of 9 Dates
Square of 9 Gann Fan
Square of 9 Intervals
Static Square of 9
Static Wheel of 24
Time Division of 3rds
Time Division of 8ths
Time Price Labels
Time Price Measure
Triple Octave Support and Resistance Lines
Triple Octave Time Support and Resistance Lines
Zero Degree Angles
Zero Price Fan
So, the point is: do you want to be a professional or not? What do they say about the difference between men and boys is the price of their toys... Lastly in my opinion trading stock, options, forex etc. You do not have to have the expensive Gann tools to wins trades. I found using the Beck's Emblem on Gartley patterns is all I need. The second and hardest part is waiting for that Gartley pattern to arrive. But with Optuma with Beck's pkg, you can scan all the markets worldwide everyday and it will find them. You don't do the work, it works for you... Easy Peasy.....The Software costs money, but makes you money if your a serious trader.
DM
{quote} Just a few minutes ago the 52 was tested for the forth time...and proceeded to drop 30 pips in minutes....I was within 2 pips of being stopped out but wanted to show the update... {image} {image}
Ignored
Good job.
GBP these days is a beast. Too much volatile. Will wait a few days to settle it down a bit. Anything less than 1H TF is a killer for me.
{quote} Leah.cim, I may be wrong but think what you asking are the Mathematical calculations derived from German mathematician Johannes Kepler. The How and Why I can't give you. In some advanced charting softwares I have seen your given a choice to use Kepler or Fibonacci ratios. A little light Gann reading (click link below photo) DM {image} {image}
Ignored
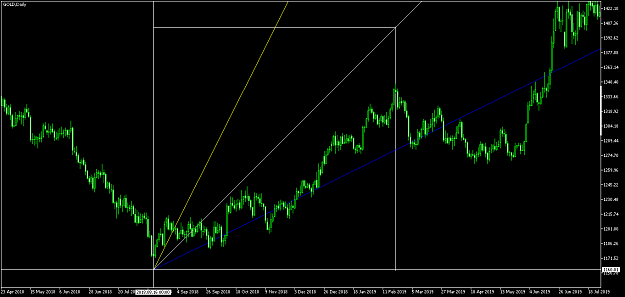
I figured it out. The angles are actually from the concept of squares. See attached
Attached Image (click to enlarge)
The yellow is the 63.8 angle and is arrived at by drawing a line through the midpoint of the upper line of the square. The blue is the 26.3 line.