Hi DrDave, thank you for sharing your results with us. I have done some testing and let's discuss it here.
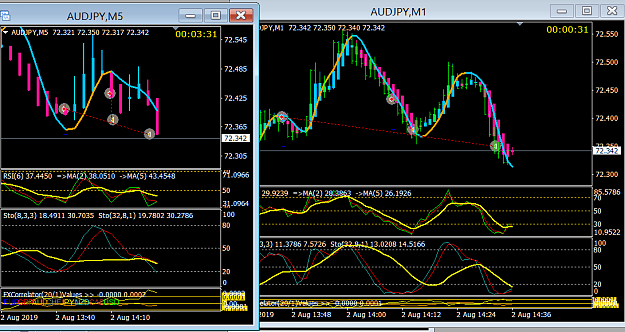
First regarding this post, I have not used the FXCorrelator indicator before, so this is still confusing to me. I will try to get a grasp of it and let you know, because so far it just confused me.
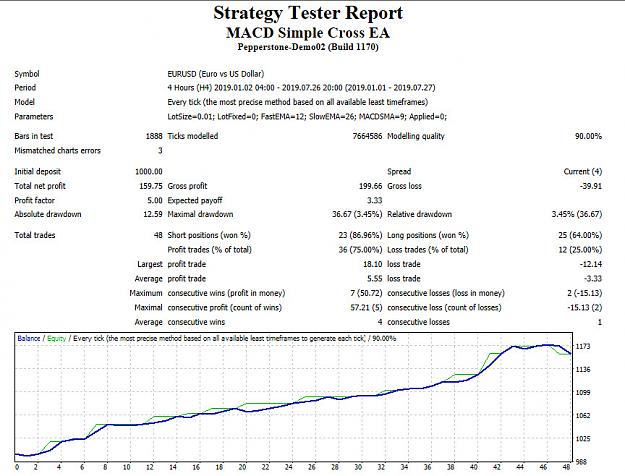
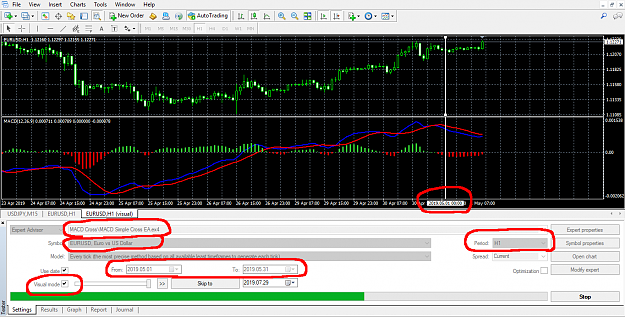
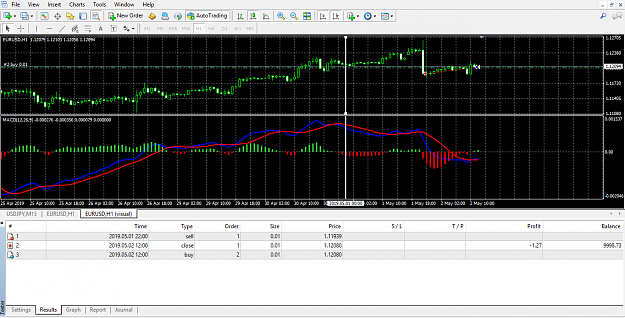
I did some checking, and I don't think the issue is with the EA or the buy/sell condition, I think it's with the system itself, and here's why:
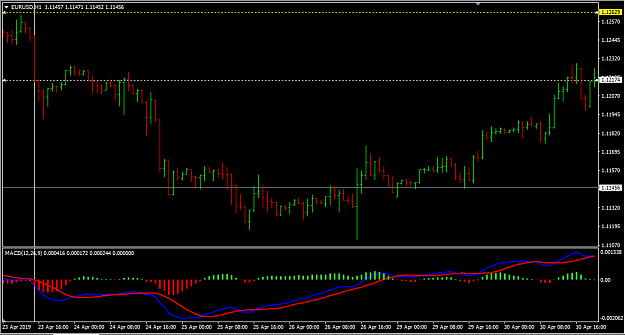
The system does not follow the trend, but it buys when the MACD and Signal Line are both below zero and MACD is crossing up, this means that the price has been going down for a while, hence the MACD and Signal Line are below zero, and since there's a cross up, we're expecting (or hoping) that the trend is about to reverse, so we buy. If it goes down further and crosses up again, we buy more because we're expecting it to go up now, and we keep buying even if the price is going down because we're saying when it reverses and goes up, we will get everything back. Sometimes, trends last longer than we hope for, so we end up losing because it goes back up, but not high enough. When does that happen? Nobody knows, it just happens, because nobody knows where the market is going. So, without a strategy for us to throw the towel and exit with a loss earlier, we can see some really huge losses. Now, here are some photos with explanations to prove my point.
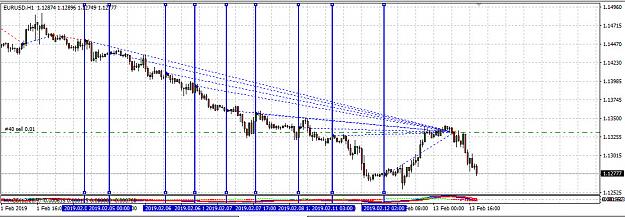
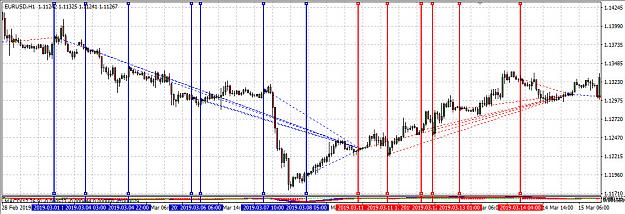
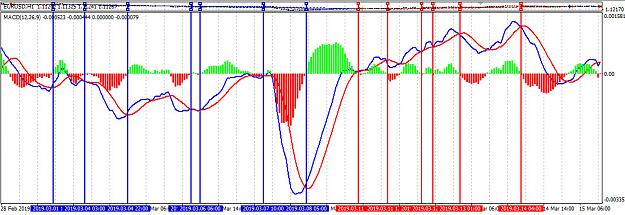
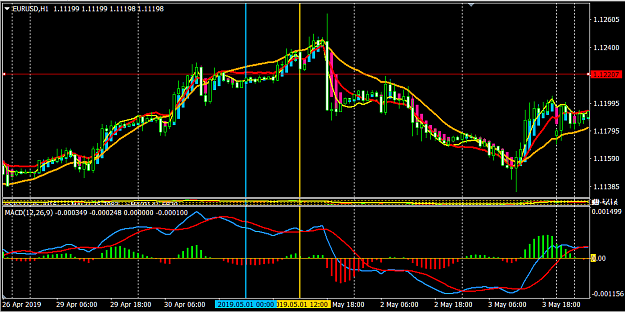
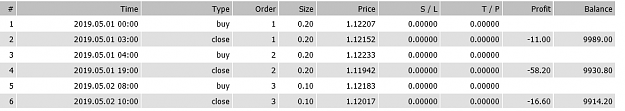
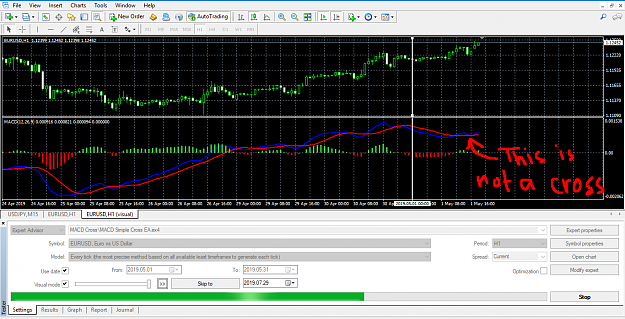
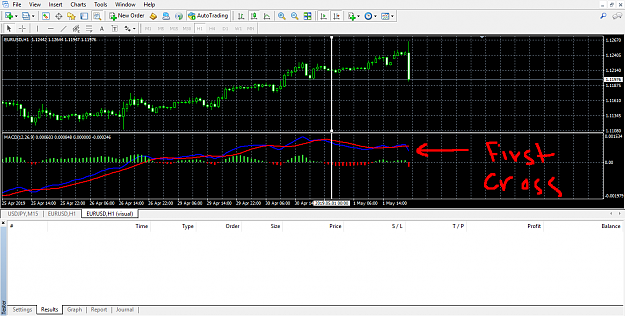
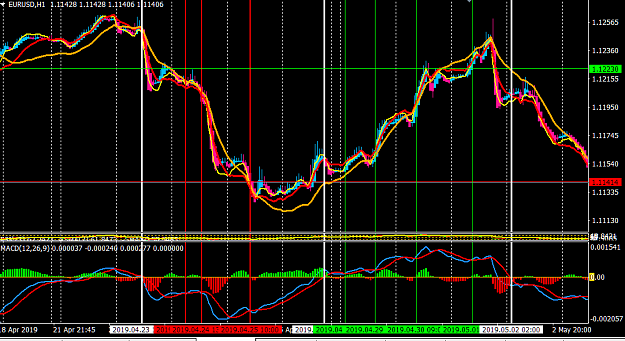
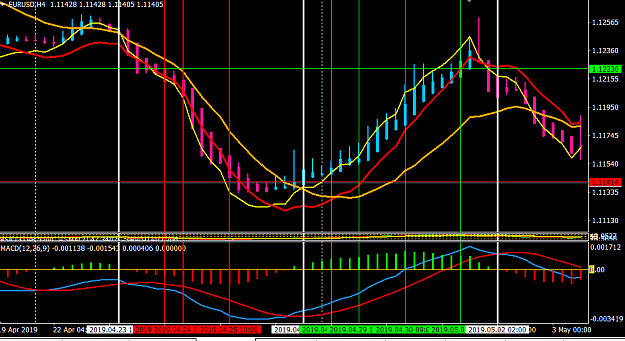
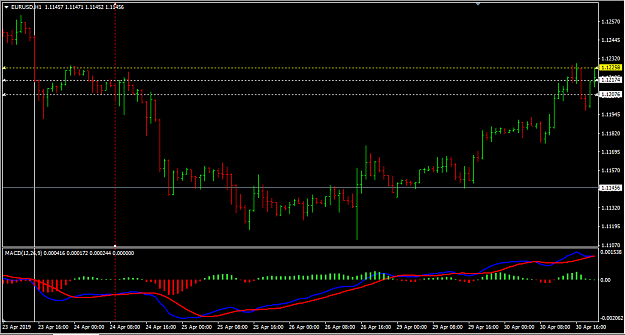
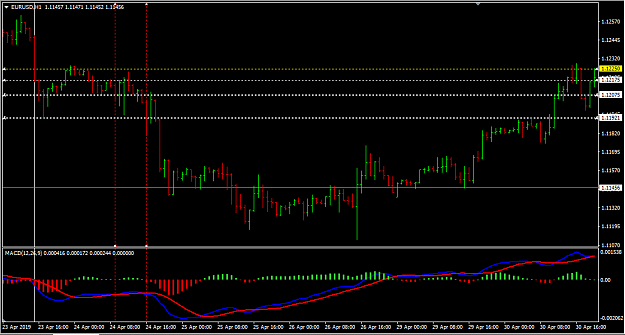
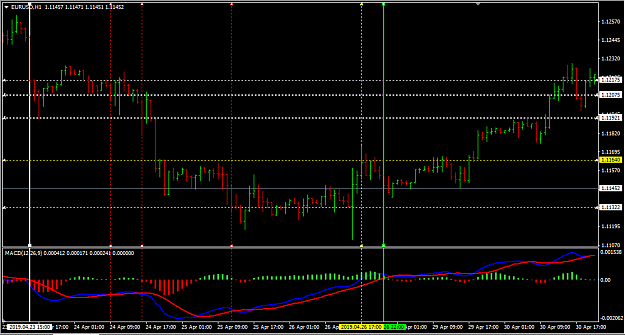
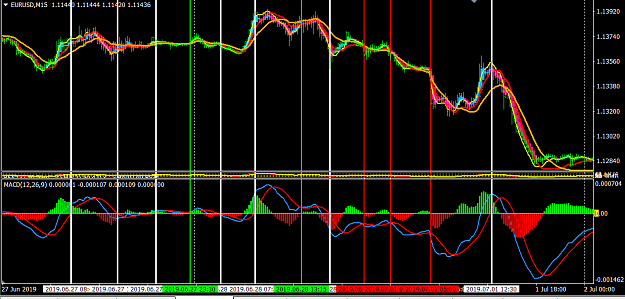
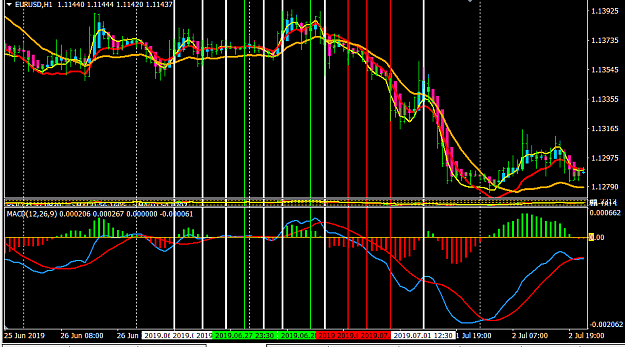
Above, is the EURUSD H1 chart, as you can see here, on Feb 04, 2019, a sell order closed and a new buy order opened (from left to right, first blue line). Now, since a sell order just closed, it means the MACD and Signal Line went below zero and the MACD was below the Signal line and now they have crossed, which means the price was moving down, and now we bought because we received a signal that told us the trend is about to reverse its course, but it was just a retracement. The price went down further and now MACD is below Signal Line. When the next retracement happened, the lines crossed again and we received another buy signal, but the price went down further, and so on and so forth until we had 9 open buy orders. Now, the price did go up eventually, but it wasn't high enough, so only the 9th order won, but the first 8 were losses. Now, why did the EA kept buying? Because it kept getting the buy signal from the MACD which is: MACD and Signal Line below zero and histogram has turned green (or MACD crossed up). See the MACD photo below with the lines corresponding to the orders.
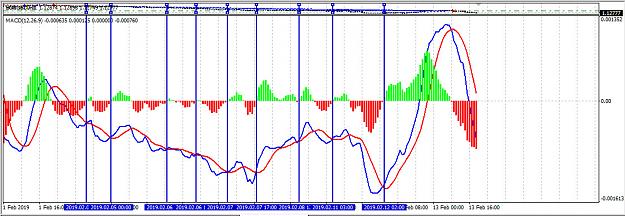
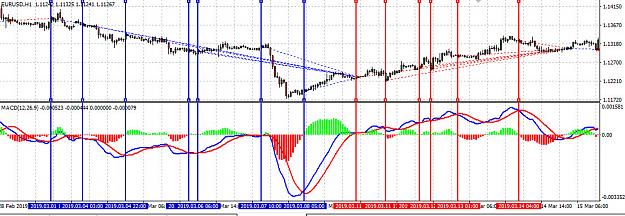
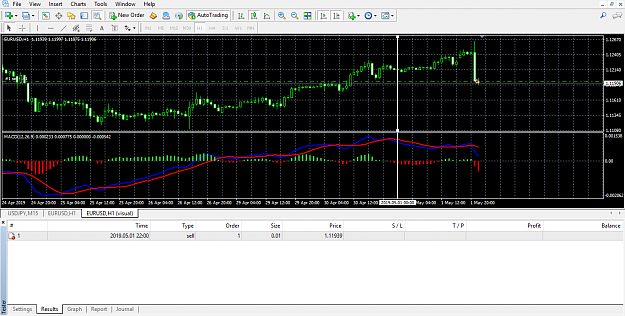
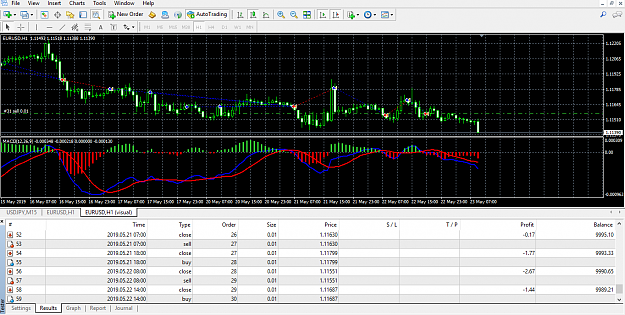
Now, those are the instances where the system collapses and loses everything. And I think if you test it again and attach the MACD indicator to the chart, you will see that it buys on buy signals, and sells on sell signals, and you'll see that the EA is doing its job, but market is not working with us here.
Now, I'm doing more tests and will share my results with you shortly.
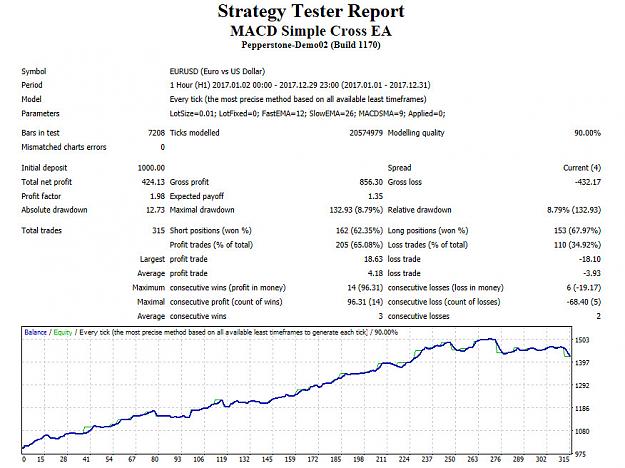
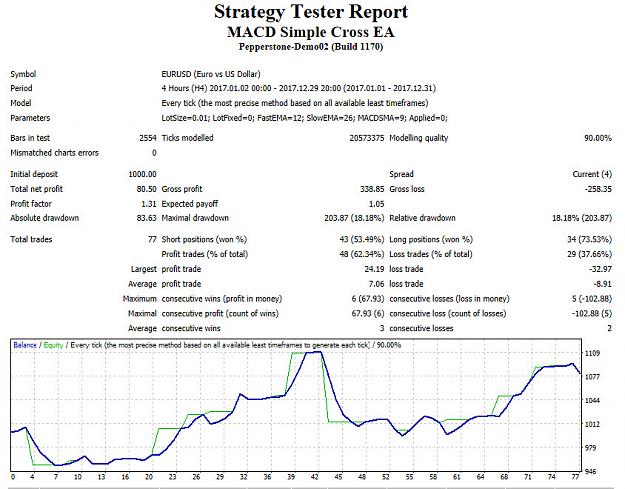
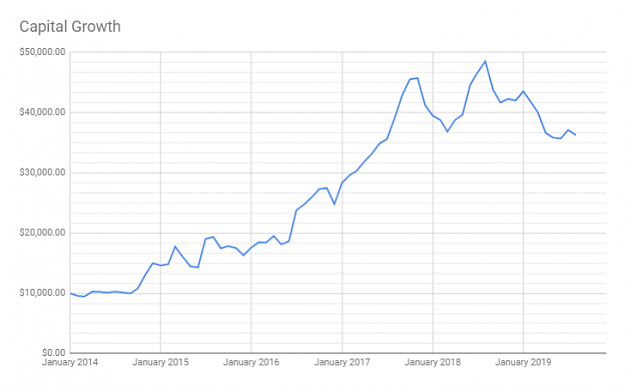
DislikedAccording to the results of 80% losers, either the EA is coded backwards, or we need to reverse the buy and sell conditions.Ignored
The system does not follow the trend, but it buys when the MACD and Signal Line are both below zero and MACD is crossing up, this means that the price has been going down for a while, hence the MACD and Signal Line are below zero, and since there's a cross up, we're expecting (or hoping) that the trend is about to reverse, so we buy. If it goes down further and crosses up again, we buy more because we're expecting it to go up now, and we keep buying even if the price is going down because we're saying when it reverses and goes up, we will get everything back. Sometimes, trends last longer than we hope for, so we end up losing because it goes back up, but not high enough. When does that happen? Nobody knows, it just happens, because nobody knows where the market is going. So, without a strategy for us to throw the towel and exit with a loss earlier, we can see some really huge losses. Now, here are some photos with explanations to prove my point.
Attached Image (click to enlarge)
Above, is the EURUSD H1 chart, as you can see here, on Feb 04, 2019, a sell order closed and a new buy order opened (from left to right, first blue line). Now, since a sell order just closed, it means the MACD and Signal Line went below zero and the MACD was below the Signal line and now they have crossed, which means the price was moving down, and now we bought because we received a signal that told us the trend is about to reverse its course, but it was just a retracement. The price went down further and now MACD is below Signal Line. When the next retracement happened, the lines crossed again and we received another buy signal, but the price went down further, and so on and so forth until we had 9 open buy orders. Now, the price did go up eventually, but it wasn't high enough, so only the 9th order won, but the first 8 were losses. Now, why did the EA kept buying? Because it kept getting the buy signal from the MACD which is: MACD and Signal Line below zero and histogram has turned green (or MACD crossed up). See the MACD photo below with the lines corresponding to the orders.
Attached Image (click to enlarge)
Now, those are the instances where the system collapses and loses everything. And I think if you test it again and attach the MACD indicator to the chart, you will see that it buys on buy signals, and sells on sell signals, and you'll see that the EA is doing its job, but market is not working with us here.
Now, I'm doing more tests and will share my results with you shortly.