Hi Melpheos, and thank you for sharing this neat fib method of yours. I've been using something similar, which I picked up from one of the instructional videos on YouTube, but your method is a bit more visual, thanks to the imaginative labelling you've employed. The entry is self-explanatory, as are the exit points.....altogether a very neat job, mate.
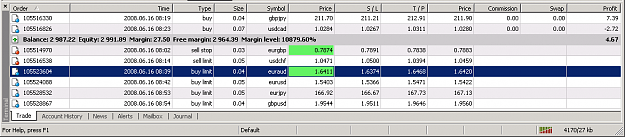
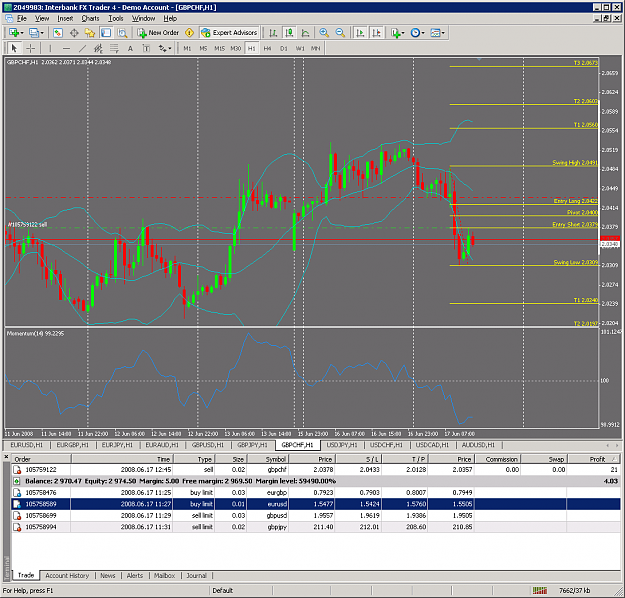
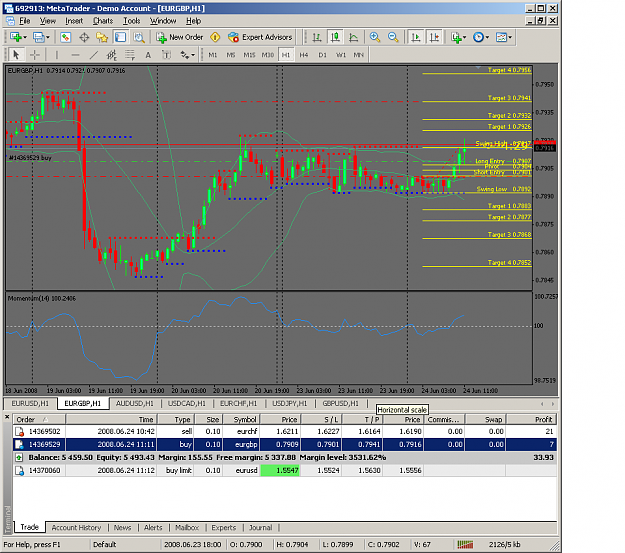
I've added a chart to this post, showing only one of the many opportunities that this method produces on a regular basis. As you can see, it's a 5m chart.....just to show that it can be done. I've added a 60ema to guide me with my entries. If price is below the MA, then I look for shorts, and above the MA, then I look for longs. Other additions are just pivot points and sweetspots (.50 and .00). As you can see, the entry on this example would have been slightly delayed due to the 1.5450 sweetspot.
Thanks again, Melpheos, and if you see anything worth commenting on, I'd appreciate your input.
Cheers
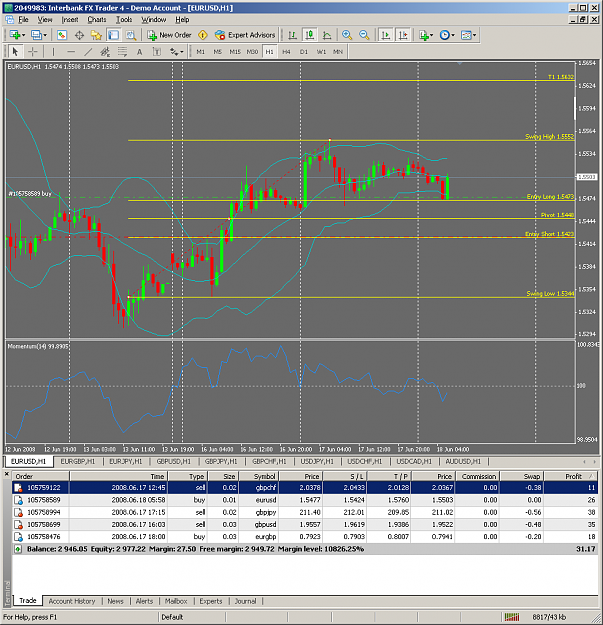
Attached Image (click to enlarge)