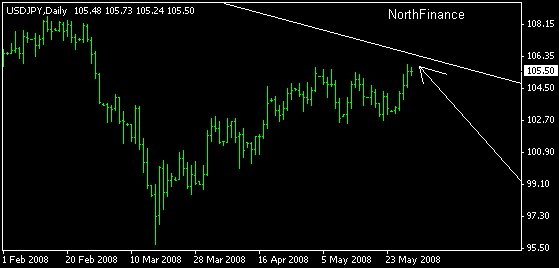
I see that when I plot trendlines on my charts the result is different. For example, look at the following charts. The first one is obtained with activetrades, while the second is North Finance. See how with Active the price is touching the trendline, while with northfinance the trendline is still above
thanks
thanks
Attached Image (click to enlarge)
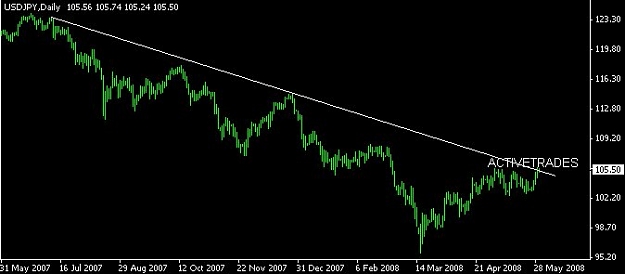
Attached Image