Greetings Micro Man:
Yes Life is very good!
Thanks for your post yesterday evening, your data on the pair, (both precognitive and physical data ) has been helpful.
The transition from EUR/USD to GBY/JPY went off very smoothly and profitably.
After my first trading experience with the GBP/JPY I quite understand the adrenalin rush you referred to. It is a rock N roll kind of pair! Your reference to "wild swings to create more tradable areas of support/resistance " is also well understood now. This is a very interesting pair!
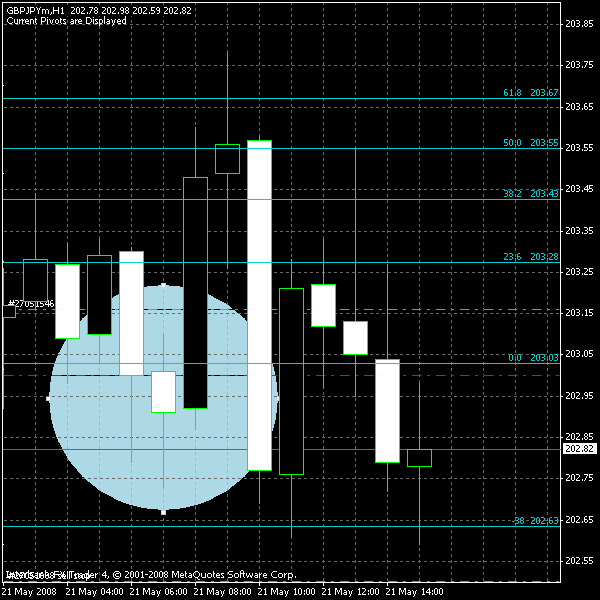
Below are two captures, the first is a capture from my trading platform to show you positions were held in the GBY/JPY. It is time stamped at 2:42 am and showing an open inventory of GBY/JPY @ 203.293 average cost. I started to go Long the pair early before bedtime and added inventories as the pair moved lower through the night. This was based on knowing there would be a rally pursuing shortly.
The second chart is the GBY/JPY (5 minute time scale) itself and the bottom horizontal portion of the chart itself is showing an approximate 2:55 am trading time at the 203.72 trading level. As you can see, the trade went off perfectly.
Your angels advice to "pull up your garder belt Dad" was also helpful as I kept a tight stop on the trade once it turned green.
Questions for you. Your use of the term "monthly pivot" is defined by you as..?
Yes Life is very good!
Thanks for your post yesterday evening, your data on the pair, (both precognitive and physical data ) has been helpful.
The transition from EUR/USD to GBY/JPY went off very smoothly and profitably.
After my first trading experience with the GBP/JPY I quite understand the adrenalin rush you referred to. It is a rock N roll kind of pair! Your reference to "wild swings to create more tradable areas of support/resistance " is also well understood now. This is a very interesting pair!
Below are two captures, the first is a capture from my trading platform to show you positions were held in the GBY/JPY. It is time stamped at 2:42 am and showing an open inventory of GBY/JPY @ 203.293 average cost. I started to go Long the pair early before bedtime and added inventories as the pair moved lower through the night. This was based on knowing there would be a rally pursuing shortly.
The second chart is the GBY/JPY (5 minute time scale) itself and the bottom horizontal portion of the chart itself is showing an approximate 2:55 am trading time at the 203.72 trading level. As you can see, the trade went off perfectly.
Your angels advice to "pull up your garder belt Dad" was also helpful as I kept a tight stop on the trade once it turned green.
Questions for you. Your use of the term "monthly pivot" is defined by you as..?
Attached Images