Hey brothers
Have you ever heard of a indicator called Trend Cluster?
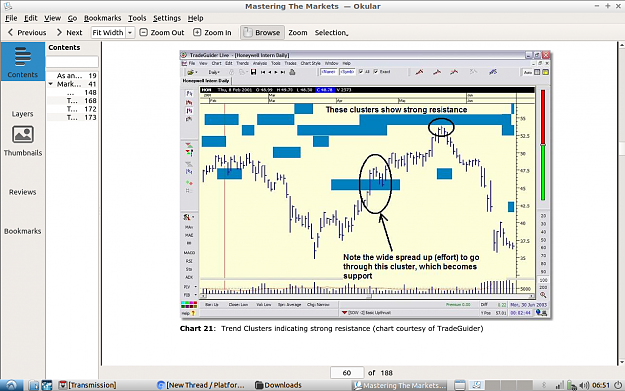
I was reading a book called Master The Markets by Tom Williams (VSA), and in one of the charts there is an indicator he calls trend cluster, what it does is paint retangular images on the chart where there are several intersecting trendlines, new and old.
What I was thinking that could be powerful is to have the ability to paint more than one timeframe in the same chart, let's say 3 different timeframes (so in a 15min chart you have the current timeframe, then you can select if you want clusters from higher timeframes let's say from 1h and daily), then you would have these cluster from higher timeframes painted as rectangles of different colors. They seem to be important levels where price reacts from.
Does anyone have something like this to share?
Thanks alot
Have you ever heard of a indicator called Trend Cluster?
I was reading a book called Master The Markets by Tom Williams (VSA), and in one of the charts there is an indicator he calls trend cluster, what it does is paint retangular images on the chart where there are several intersecting trendlines, new and old.
What I was thinking that could be powerful is to have the ability to paint more than one timeframe in the same chart, let's say 3 different timeframes (so in a 15min chart you have the current timeframe, then you can select if you want clusters from higher timeframes let's say from 1h and daily), then you would have these cluster from higher timeframes painted as rectangles of different colors. They seem to be important levels where price reacts from.
Does anyone have something like this to share?
Thanks alot
Attached Image (click to enlarge)