I missed the move up today while I had drawn the divergence on my chart.
I was strayed due to too much of old habit-thinking which I have to bin a.s.a.p.
Happy to be here
Interested to see your comments and chart Alan
The signals are very clear. Apart from those already described Look at this latest 5 min signal 34 pips of pure profit via RSI divergence. We can see price fails to break the average, it is in divergence suggesting a cross of the EMA and the average failing to make the HH attempts to make a LL. {image}
Ignored
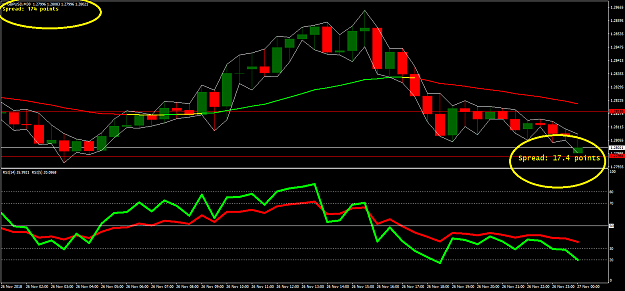
Sunday open and everyday after 5 pm EST GBPUSD spread spike.
The spread at time that you sort was very high ,do you enter even is the spread is over 170 points?
{quote} NALA66, This quote alone may be the most important quote (in my eyes) in forex knowledge I have seen. Although my job does not allow me to trade your system. This quote has opened my eyes that it also works with my 36LWMA. I trade W-D-H4 TF. Price Always returns to average. Leaving a road map when there are forks in the road. Thank you for your knowledge and i look foreward to reading more.
Ignored
Thanks...
I wouldn't actually say price always returns to an average. It is the average of prices so the average is always chasing the price not the other way round and at some point the average will catch up to price.
This is why I compare average to average so for me the swings become the price destination levels (Resistance levels if you like)
{quote} Sunday open and everyday after 5 pm EST GBPUSD spread spike. The spread at time that you sort was very high ,do you enter even is the spread is over 170 points? {image} {image}
Ignored
Hi I see you are trading in the USA. That being the case you have some very serious limitations in the so called land of the free.
Leverage limited to 50:1
Not allowed to hedge.
And the FIFO rule (First in first out)
These are all serious limitations making it very difficult to trade in the USA and would stop you from making the same profits as I do. However you can still use most of the stuff I have talked about for much smaller returns.
My spread is fine when the European sessions begin round about 1.2 pips it is usually higher during the early stages of the Asian session however this is the cost of doing business. Let's face trading Forex is relatively cheap, free charts, free data and instant results so we can't complain too much hey!
I missed the move up today while I had drawn the divergence on my chart. I was strayed due to too much of old habit-thinking which I have to bin a.s.a.p. Happy to be here Interested to see your comments and chart Alan
Ignored
Of course missing entries due to whatever else is going on in our lives is always going to present problems, however, another bus will come along soon and we can take advantage of that fact alone. I will post yesterdays chart when I have done with these messages.
You appear to be doing fine, keep it up because practice makes perfect and it will become second nature to you just like driving a car was difficult at first.
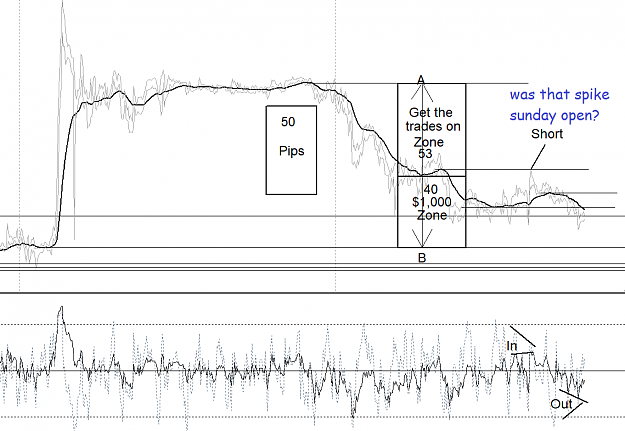
Ok I think that is all the questions so lets take a look at yesterdays moves...
The chart on the right is the 1 hour so I begin by taking inference from it that price is going up. There was divergence at the bottom inferring price is going to cross the EMA so the level at A (average swing low) is going to fail so we should see the bulls try to make the HH at 2. This happened.
Now when we drop to the 5 min chart we see a whole pile of possible entries cause by RSI divergences.
So price going up we are long on the signals and the pull back signals are hedges until we reach the top where we close all the longs and begin to short. The same process happens we are going down so take the signals short and the signals for the pull backs are hedges until we reach 3.
Note when a hedge signal crops ups another signal tells when to remove it. It is a good idea to take these hedges because they are risk free and add to your 40 pip count. As you see the score here was many more pips than you need to make the $1,000 indeed 2 or even 3k was on the table to be taken.
Thank you for starting this thread it is helping me a lot. I've few questions to ask.
1: What is 2 bar or 3 bar test?
2: How do you choose the range to trade in just like you select 50 pip range everyday, how do you determine that?
3: My RSI values are bit different than yours, i think your RSI chart is more volatile than mine. Am i doing something wrong, i'm using same 5 Period RSI (on previous indicator data) on top of 14 period RSI.
Ok I think that is all the questions so lets take a look at yesterdays moves... The chart on the right is the 1 hour so I begin by taking inference from it that price is going up. There was divergence at the bottom inferring price is going to cross the EMA so the level at A (average swing low) is going to fail so we should see the bulls try to make the HH at 2. This happened. Now when we drop to the 5 min chart we see a whole pile of possible entries cause by RSI divergences. So price going up we are long on the signals and the pull back signals...
Ignored
So we should close all the trade when price touch ema swing in H1 ? And can you explain more how you view the market when you change from buy to short at point 2
Thank you for starting this thread it is helping me a lot. I've few questions to ask. 1: What is 2 bar or 3 bar test? 2: How do you choose the range to trade in just like you select 50 pip range everyday, how do you determine that? 3: My RSI values are bit different than yours, i think your RSI chart is more volatile than mine. Am i doing something wrong, i'm using same 5 Period RSI (on previous indicator data) on top of 14 period RSI.
Ignored
1) A two bar test is exactly that. Ideally done in the direction of the trend for example below the EMA we test by drawing a line on the bottom of the two bars to see if the next bar closes below the test line for a short.
2) The market is generally going to move more than 50 pips in either direction so if I can see an average swing high or low covering this distance on the hour chart then I am going to look for signals to take me there.
3) I can't explain why you are getting a difference, you certainly shouldn't be because the RSI is a mathematical expression of the price.
{quote} So we should close all the trade when price touch ema swing in H1 ? And can you explain more how you view the market when you change from buy to short at point 2
Ignored
Well when the price was at point 2 it has hit the top of the swing and it does so in divergence of the 5 min so it is spent.
If there were no divergence then it would push on. However a second clue is on the 1 hour chart look how the fast RSI is way up the top but the average is a mile away. So would you expect this average is going to make a HH, I think not. So it makes a LL instead.
Thank you for starting this thread it is helping me a lot. I've few questions to ask. 1: What is 2 bar or 3 bar test? 2: How do you choose the range to trade in just like you select 50 pip range everyday, how do you determine that? 3: My RSI values are bit different than yours, i think your RSI chart is more volatile than mine. Am i doing something wrong, i'm using same 5 Period RSI (on previous indicator data) on top of 14 period RSI.
Ignored
Hello, my RSI also has other values than Alan, even though I have exactly the template. Is it possible that my broker works with other prizes ... I have AM
{quote} For me it is very import the bulls or bears FIND support for their respective moves and the moves are from average swing to average swing like this.. {image}
Ignored
Thanks for the explanation an keep up with the good work
Thanks again Alain
Regarding the hedges, that's something I never did because it has a disadvantage... it has a price (spread and commission). I rather closed positions and hop on again later on than helping nobody else except for my broker by paying him.
Right now I started to think different on that. It's worthwhile to pay that price because the hedge forces me to stay focused and to find a good way to get out of it / go on with the plan.
Thanks again Alain Regarding the hedges, that's something I never did because it has a disadvantage... it has a price (spread and commission). I rather closed positions and hop on again later on than helping nobody else except for my broker by paying him. Right now I started to think different on that. It's worthwhile to pay that price because the hedge forces me to stay focused and to find a good way to get out of it / go on with the plan.
Ignored
That is funny because the cost of not hedging is the loss of profit far greater than any fees incurred. You know your trade is safe no matter which way it goes, let's call it the cost of insurance.
{quote} Hello, my RSI also has other values than Alan, even though I have exactly the template. Is it possible that my broker works with other prizes ... I have AM
Ignored
Can you guys post a chart so I can take a bow peep at what is going on. 5 min is preferred.