One of few intelligent and useful approaches to trading. I enjoy the simplicity of your charts.
In the UK, if you can clear only ten pips a day that soon adds up. ( I speak as a retired person trading for only two hours a day for extra pocket money )
One of few intelligent and useful approaches to trading. I enjoy the simplicity of your charts. In the UK, if you can clear only ten pips a day that soon adds up. ( I speak as a retired person trading for only two hours a day for extra pocket money )
Ignored
Hi, and a warm welcome to the thread to you also.
I have to say I enjoy the simplicity of my charts, too! I spent many years testing and using pretty much everything you can think of and sometimes my chart had so many lines it did look like a plate of coloured spaghetti! None of it, I noted, made me a better or more accurate trader so, little by little, I ditched it all to end up as a quite minimalist price action trader that I am now.
You are very right that you don't need so many pips to be nicely profitable. What matters is what your downside and consistency are. If you are risking 200 pips a trade you need hundreds to make some reasonable money. A method with tighter stops means a smaller, more achievable target requirement for the same profits. Equally, if you can make the pips regularly without long, deep drawdowns to your account, you can trade more smoothly for less pips and let the profits accumulate steadily.
{quote} Hi, Your method as described looks pretty solid to me. I like the idea of seeing a break and then waiting for a test, this is a strategy that has withstood the test of time, many good traders have used variants of it in the past. Using a higher timeframe to look for setups is also a common and rational method. I like to stick with only the M1 chart, I just have a look at the very start of the day what the prior swing high and low has been on the M5 chart as a basic frame of reference and that will do for me. I also used to use a simple 20...
Ignored
Hi Oldmantrader,
Thanks for your reply.
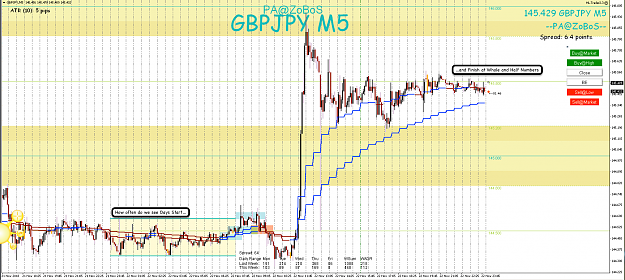
I am trying to reduce the clutter on my charts.
I must admit, though, I do like to be able to see the Whole and Half Numbers and .00200 and .00800.
You probably know better than I do how Big Money uses them.
If nothing else it tells me at a glance how far Price has moved over the day.
{quote} Hi Oldmantrader, Thanks for your reply. I am trying to reduce the clutter on my charts. I must admit, though, I do like to be able to see the Whole and Half Numbers and .00200 and .00800. You probably know better than I do how Big Money uses them. If nothing else it tells me at a glance how far Price has moved over the day. {image}
Ignored
Hi,
You have to use what works for you. There is no definitive 'best' method and trading is inherently subjective, personal, and tightly bound to your psyche and emotional makeup. I like minimalism, others like tons of indicators and more all over their charts. All that matters is does it derive you a consistent edge and can you make consistent money with it?
It also explains why I don't mind putting all my trades and reasoning on this thread. Anyone can copy it as much as they like but they are not me (possibly very fortunately!) and so will not trade like me, even with the exact same method in the exact same markets. You and your method are inextricably bound.
As for round numbers, they have always been natural barrier points on a chart, even though rationally it makes little sense outside of the human psyche. I have already mentioned in posts how I like to have price targets shy of a round number because I don't want to take on the potential of massed reversal orders/decisions possibly stacked up there. Why make winning the trade harder than it need be?
Hi! Subscribed... this thread is great (I really like the minimalistic charts) Regards Swnlobo
Ignored
Hi Swnlobo,
A warm welcome to the thread to you and thank you for your kind words.
I am hoping a real trading journal with focused explanation is more helpful than simply posting random opinion across FF. Certainly, when I was learning trading, what I really wanted to see was how it panned out in real life and there was a real lack of that about.
That said, apologies, no live trading today, I am treating myself to a cheeky Friday off as this week has been a good one. Will be back with more trade postings on Monday.
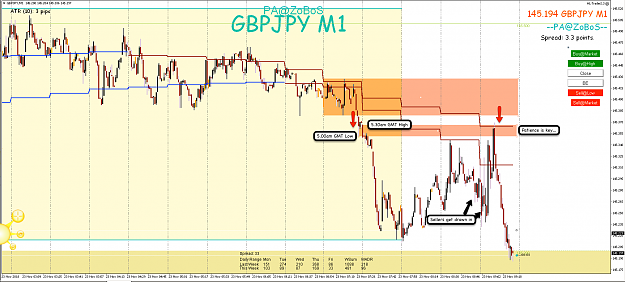
GBP/JPY M30/M1 Observations Patience is Key when it comes to Trading. {image} {image}
Ignored
Hi,
You are so right, patience is one of my 'six sigma' (my weak humour, sorry) key mantras on trading that I always keep front of mind:
patience
discipline
risk control
consistency
emotional balance
method
They are obviously interrelated and a coherent trading regime incorporates all of these in a mutually supportive way. Notice that the mechanical/technical aspects of your trading method is just one element, the other five are all essentially psychological/emotional in nature. This is a core truth of trading that many miss - you are rather more important than your method in determining your trading results.
Returning to patience, your charts well illustrate that you generally don't have to rush to get into a trade. The market very often puts in a sucker move the other way before finally setting off where it wants to go. If you wait for that you both improve your odds of success and can often get a better entry price. Equally, as I have mentioned before, the bulk of a move tends to occur towards the end of that move so a good trend can usually be quite happily entered well down the track.
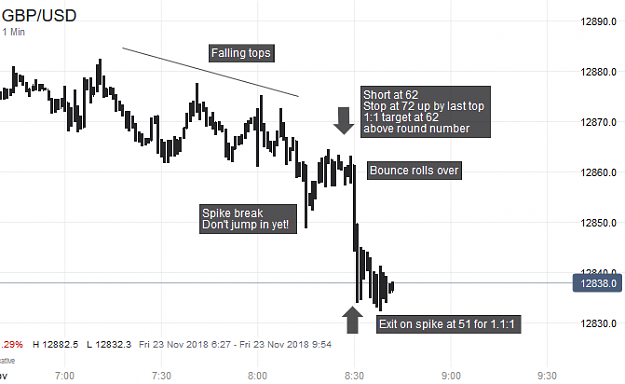
Now I know I said repeatedly I was taking the day off today but a habitual quick look around the markets over my first coffee of the day led me to the GBP/USD market where I was compelled to take the following trade:
Attached Image (click to enlarge)
We see falling tops so I would be bearish for first choice in a dull market, and then a sharp break. I won't jump in on the break for fear of being suckered on a fake move, but if it can try to rebound and fail, I'll be getting interested.
Sure enough, the bounce rolls over at the previous range base - prior support turning to new resistance, a common market observation - and I am short at 62 on a 10pt stop above the bounce and right up by the last prior high. A 1:1 target is just above the spike low and the round number. All of this makes it a nice trade and our good fortune for the week continues with a quick profit at 51 on the spike down.
I am definitely gone until Monday now, have a great weekend all.
{quote} Hi, You have to use what works for you. There is no definitive 'best' method and trading is inherently subjective, personal, and tightly bound to your psyche and emotional makeup. I like minimalism, others like tons of indicators and more all over their charts. All that matters is does it derive you a consistent edge and can you make consistent money with it? It also explains why I don't mind putting all my trades and reasoning on this thread. Anyone can copy it as much as they like but they are not me (possibly very fortunately!)...
Ignored
Yes -I think your point was proven by the research into the "Turtle Traders" individual performances.
Great thread OT. Nice clean explanations, like your charts. Whats assets do you trade ?
Ignored
Hi,
A warm welcome to the thread and thank you for your kind words.
The only problem trading off very small timeframes, compared to longer ones, is that costs tend to have a greater impact because the absolute price movements tend to be relatively smaller. This means, to be viable, I have to limit trading to only the lowest round trip cost markets that are liquid, active and freely traded.
Markets come and go according to these criteria but at the moment I trade:
4 forex markets - EUR/USD, GBP/USD, AUD/USD and USD/JPY
3 equity indices - DAX, FTSE, DJIA
I wouldn't want to cover more than this number in total for reasons of spreading myself too thin; and even here the DAX & FTSE don't really overlap with DJIA - Europe in the morning, US after lunch.
I don't worry about cross-market correlations because I only ever have one position open at any time. I go through the markets in a continuous cycle until I settle on the one I like best right now. Then I just sit and watch that one in isolation until I either get a setup to trade or it evaporates away. Then the process repeats ad infinitum (with frequent coffee breaks) until the end of my trading session.
I'd love to trade some commodities and individual shares but they generally fail under cost and/or activity criteria on my M1 TF. I've never had enough interest in bonds or interest rates to want to trade them. Cryptocurrencies I just don't like because of both very wide bid-offer quotes and because it seems to me the rules can change at any time (probably means, being old, I just don't understand all this new funny money).
{quote} Hi Oldmantrader, Thanks for your reply. I am trying to reduce the clutter on my charts. I must admit, though, I do like to be able to see the Whole and Half Numbers and .00200 and .00800. You probably know better than I do how Big Money uses them. If nothing else it tells me at a glance how far Price has moved over the day. {image}
Ignored
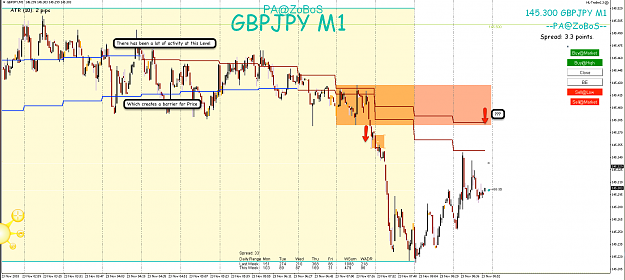
Slightly off topic ( 1 minute charts) but purely out of interest. And I cannot find the chart right now -but your 5 minute chart reminded me of a Brent 5 minute chart I looked at a few days ago. The point is that the 5 minute frame had Brent in a very tight range until breaking up -that was when the 1 Minute chart stopped ranging and took off.
{quote} Slightly off topic ( 1 minute charts) but purely out of interest. And I cannot find the chart right now -but your 5 minute chart reminded me of a Brent 5 minute chart I looked at a few days ago. The point is that the 5 minute frame had Brent in a very tight range until breaking up -that was when the 1 Minute chart stopped ranging and took off.
Ignored
Hi,
I'll leave the discussion of the 5min GBP/JPY chart in question (post #23) to stevepatt, whose chart and post it is.
Your more general point of how the m5 and m1 timeframes correlate is clearly true, and I believe stevepatt mentioned that in an earlier post of his here (post #19) that he likes to use m30 in conjunction with m1 charts to find his entries.
Multi-TF analysis is very common and has understandable logic but, as I have mentioned before, my minimalist approach means I stick almost entirely to the m1 TF - just a first look at the m5 chart for each market first thing of a morning to get the bigger starting picture, and then it's pure m1 from then on for me. Both can work, simply a matter of personal choice.
The underlying reason I stick to just one TF may be a little contentious: I don't really believe in technical analysis! I know I am a happy 100% price action trader but I cannot automatically see any rational reason why future price behaviour should be directly predictable from prior squiggles on a graph. I can automatically understand why prices will eventually reflect fundamentals but the correlation between the two is pretty loose at shorter TFs so not much use to trade with, especially if you want tight stops as I do.
What the prior squiggles do tell me is a visual record of the battle between buyers and sellers at any given time. All I want to be is on the right side of that battle a llittle more than 50% of the time, and the m1 chart gives me that adequately enough, as well as suggesting the last point at which the balance changed so I have a clue for some sort of protected stop point.
But I really don't believe you can divine anything more detailed from a chart at any TF or multi-TF, so I keep it simple and stick to just the one TF. When I see articles/books/websites with titles along the lines of 'Every candle tells you a story - if you can read it!' I have genuine trouble believing that. It's mostly noise and market moves are mostly random. I'm OK with that and the statistical evidence supports it. But it's not completely random - the evidence supports that, too - and so an edge can be found in specific circumstances. That is all I want and all I rationally think I can expect from technical analysis - a slight head start, not a precise prediction.
All that said, please remember that trading is very personal and we each see the same information in different ways. Thus, I believe any sensible method can work, but you do have to find one that suits you and that you can believe in. My method as posted on this journal works for me and I'm not representing it will necessarily work for anyone else. But if it gives people some ideas and things to think about to help them in their own trading, that's great and I'll be happy enough!
{quote} Hi, I'll leave the discussion of the 5min GBP/JPY chart in question (post #23) to stevepatt, whose chart and post it is. Your more general point of how the m5 and m1 timeframes correlate is clearly true, and I believe stevepatt mentioned that in an earlier post of his here (post #19) that he likes to use m30 in conjunction with m1 charts to find his entries. Multi-TF analysis is very common and has understandable logic but, as I have mentioned before, my minimalist approach means I stick almost entirely to the m1 TF - just a first look at...
Ignored
All I want to be is on the right side of that battle a llittle more than 50% of the time, and the m1 chart gives me that adequately enough, as well as suggesting the last point at which the balance changed so I have a clue for some sort of protected stop point.....and so an edge can be found in specific circumstances.
That really sums it up I think - price action and its' tipping point. And your thread gives plenty of nourishing food for thought :-)
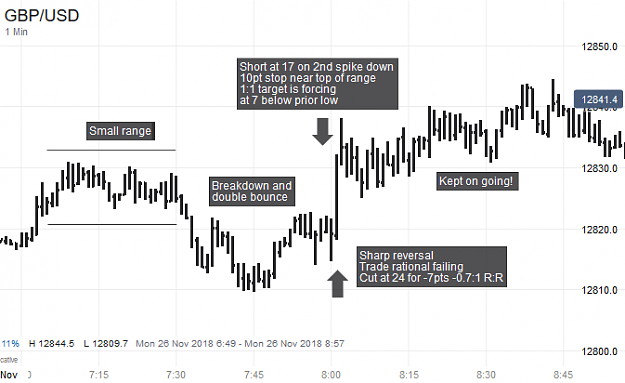
Two trades for you today starting, perhaps unsurprisingly after the winning run last week, with a losing trade in GBP/USD:
Attached Image (click to enlarge)
We see the market early in a small range. A breakdown tries to bounce back twice, stopping both times at the prior range low just above 20. A spike down also tries to reverse but spikes down quickly again a second time. All of this is enough to tempt me into a short at 17 on a 10pt stop back up at the top of the prior range; the market should not get there if the trade is good. The 1:1 target at 07 is forcing, being below the prior low at 10 but I will move stop to breakeven if we reach the low.
This time, however, we get nowehere as the market leaps up against us. This is not good and strongly suggests the trade is wrong so the trade is cut early at 24, as soon as it clears the last bounce high to lose 7pts, a -0.7:1 R:R. There is little point waiting and hoping now, it isn't working so get out to salvage what you can, you don't have to wait for the hard stop to be hit, that is our failsafe risk control backstop. We see the market subsequently kept on going up, we were suckered wrong here but that's life - always remember we are dealing in probabilities, not certainties, and we must always act accordingly.
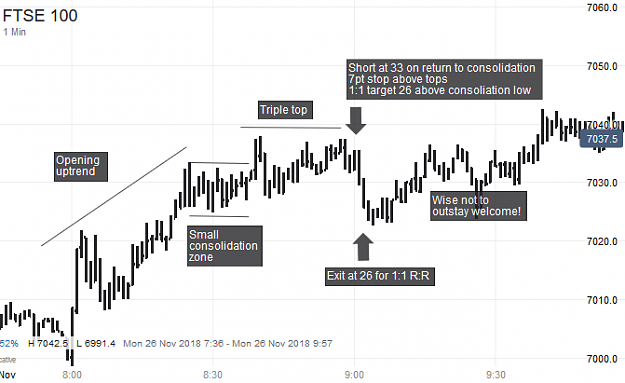
Market opens at 8am with a decent uptrend, stagnating into a small range. Three breakout attempts creates a triple top which then falls back into the range. This is enough to make me want to go short even though this is risky because the inbound trend was going up. However, recall I said in an earlier post that I am always wary of an early morning move being a fake, and this was the view I took again here.
We are short at 33 and a 7pt stop above prior tops is enough if we are right on this trade. The 1:1 target at 26 sits nicely just above the bottom of the earlier range where support is quite possible. Happily, this time the move does crack on down and I am content to exit at the intital target for a 1:1 R:R rather than take on the prior low. This proves wise as the market does turn around there. An excellent illustration of trying to take trades where the initial target is comfortably achievable ahead of a potential reversal point. If the trade moves really strongly your way you always have the option of moving the stop to breakeven and play for a further leg.
The two trades net out at +0.3:1 R:R and I am happy to stop here. Both trades felt, in truth, a bit forced and this is indicative of my mindset not quite being 100% today so I will move to demo only for the rest of today. Such a self-imposed psychological stop is a good trait to develop - it helps to avoid loss of control and not letting feelings like greed, revenge, complacency or poor judgement take control. We are all human, and not all days can be great days for our trading mind.
Hi again, And the second trade today is in the FTSE: {image} Market opens at 8am with a decent uptrend, stagnating into a small range. Three breakout attempts creates a triple top which then falls back into the range. This is enough to make me want to go short even though this is risky because the inbound trend was going up. However, recall I said in an earlier post that I am always wary of an early morning move being a fake, and this was the view I took again here. We are short at 33 and a 7pt stop above prior tops is enough if we are right on...
Ignored
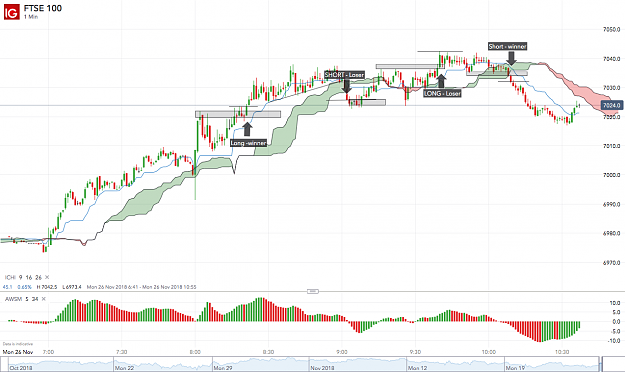
Was on FTSE on 1 minute until 10:30am
My layout shows a couple of losers but I think Ichi seems to work better at levels. Levels or consolidations are important whatever your approach. Your approach seems purest on approach to levels etc without *fluffy* clouds in the way
{quote} Was on FTSE on 1 minute until 10:30am My layout shows a couple of losers but I think Ichi seems to work better at levels. Levels or consolidations are important whatever your approach. Your approach seems purest on approach to levels etc without *fluffy* clouds in the way {image}
Ignored
Hi turnip15,
Many thanks for outlining your approach here, some contrast is good to stimulate thought and it demonstrates there are lots of ways you can go about trading.
That your chart shows 2 winners and 2 losers is typical, most edges in trading are small. It's being able to eke out a profit over a sequence of trades, and having the fortitude to keep grinding along with discipline, consistency and patience when things continually ebb and flow for you that helps separate winning from losing traders.
Thank you for posting your trading setups and talking us through the logic. It's both informative and insightful. I look forward to following your journal.
I have a quick question if you would be so kind. what is your philosophy with regard to multiple trades in a day? will you only take a second if your first is a loser etc?