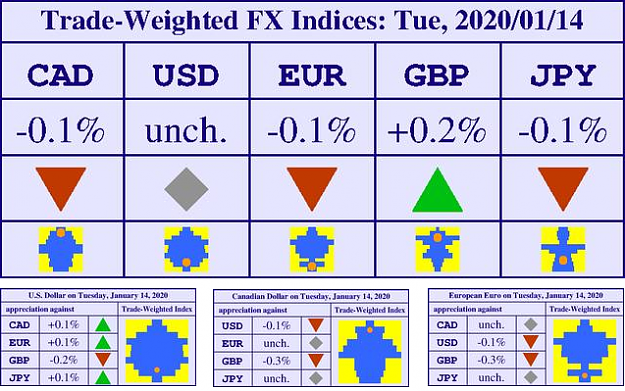
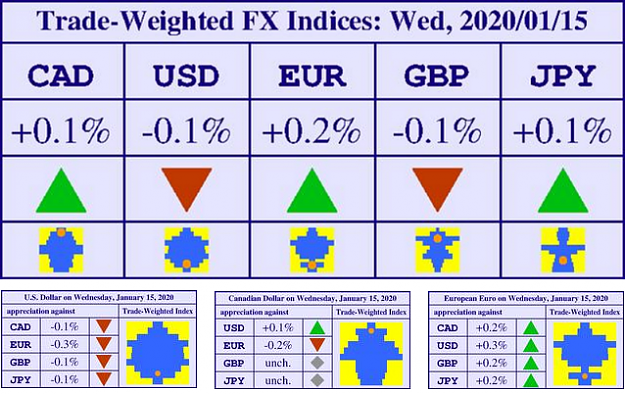
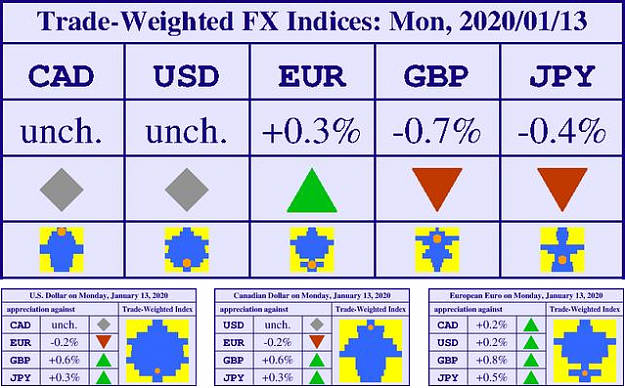
The chart image below summarizes the relative position of an exchange rate relative to its performance over the last year. The yellow background indicates the square dimension of the chart. The orange dot indicates today's position relative to the high (top of the chart) and low (bottom of the chart) of the FX index during the last 365 days. So if the orange dot is close to the top, the currency is close to its highest valuation. If the orange dot is close to the bottom, the currency is near its lowest valuation. The blue bars indicate the distribution of valuations over the course of one year. The span between high and low valuation is divided into ten ranges (ie, deciles). Then the number of days during which the currency's valuation has been in each of these deciles is counted. The number of days is proportional to the width of each of the ten blue bars. Thus the position of the orange dot relative to the width of the blue bars indicates if the current valuation is a relatively common event or a relatively rare event. For example, if the bulk of valuations has been in the lower deciles, and the orange dot is near the top where the bars are narrow, the currency has recently moved up sharply. These charts ("FX conifers") are a simple method of visually summarizing the performance of a currency over the time period of one year. One useful feature of this chart is that it automatically adjusts for the different volatility of currencies, as the span between a one-year high and one-year low is a reflection of a currency's volatility.
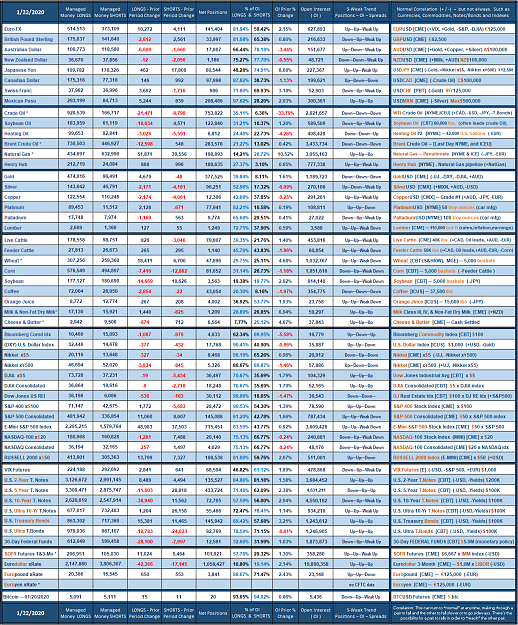
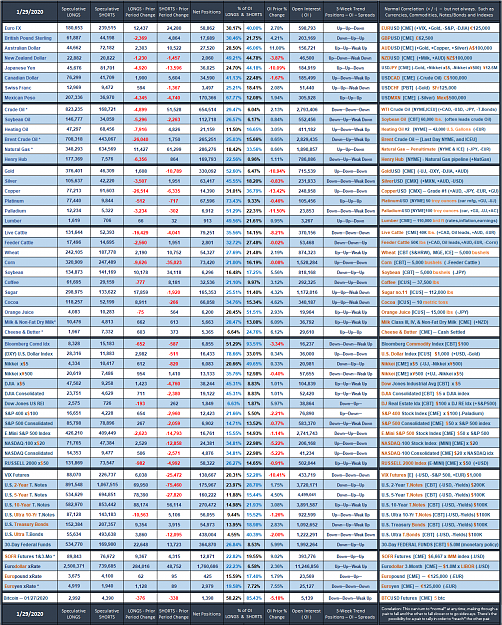
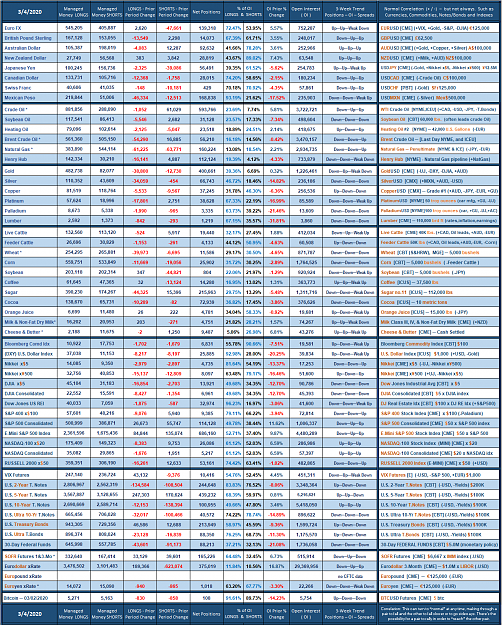
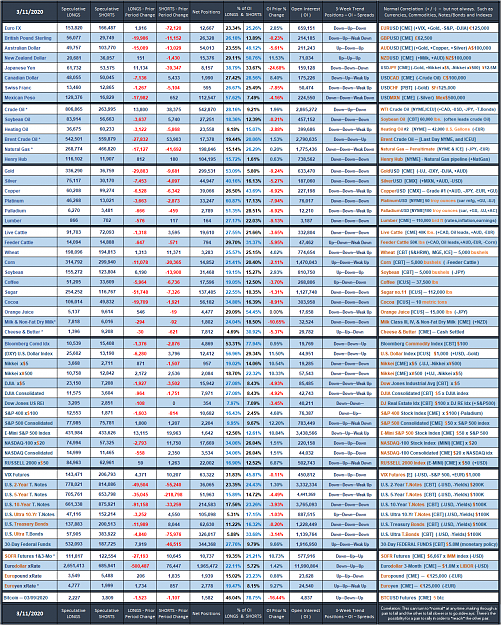
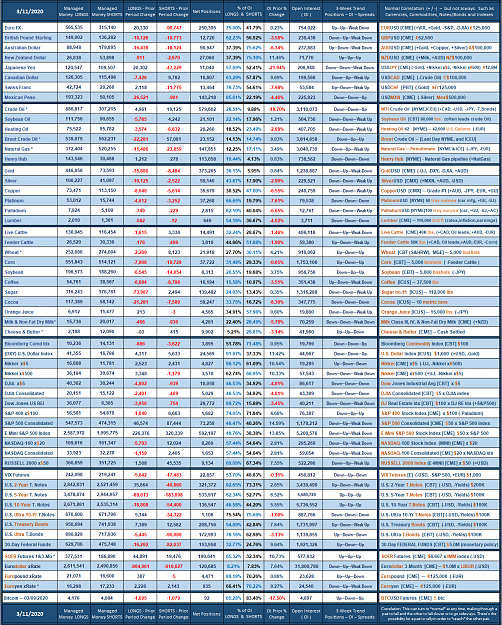
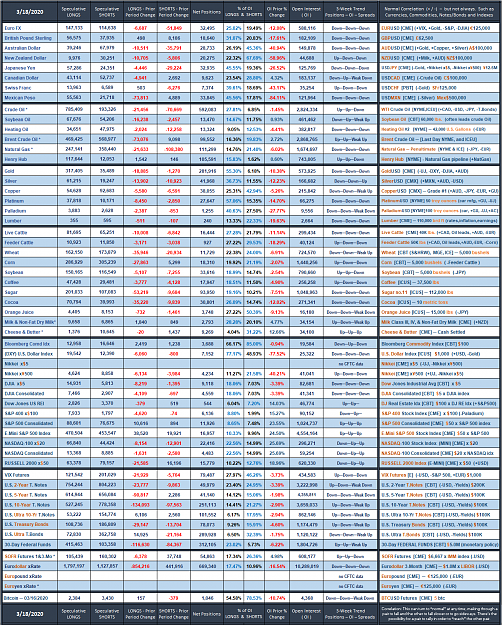
☝ These are not fundamental determinants. Users are advised to read them with considerable caution.
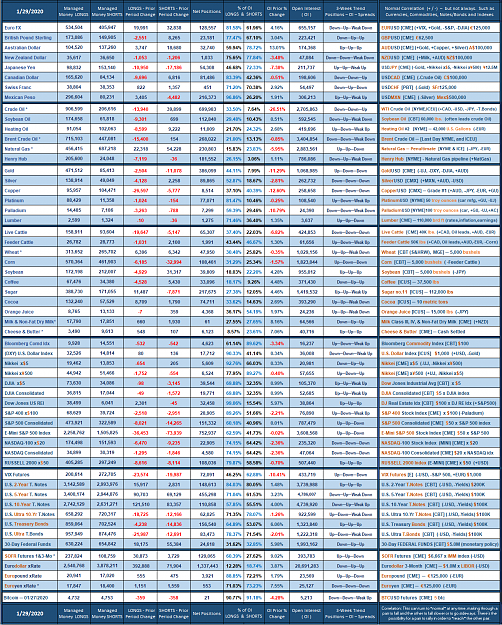
☝ These are not fundamental determinants. Users are advised to read them with considerable caution.
Attached Image (click to enlarge)
Since Frank Sinatra sings in his own way, my chart sing... I did it, my way