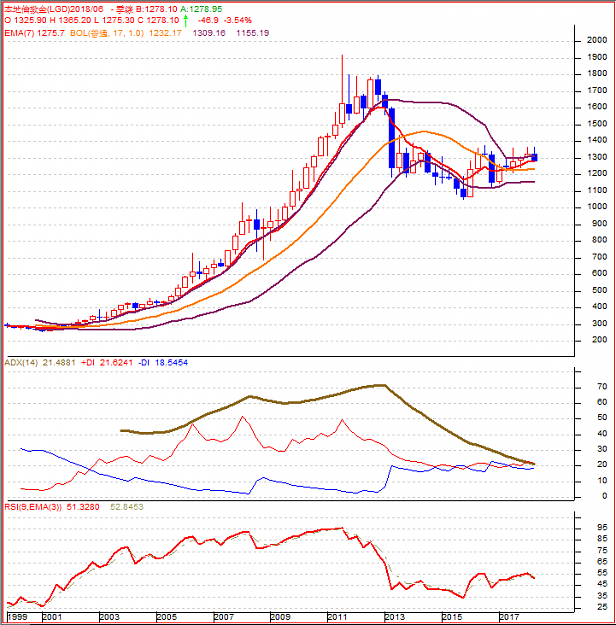
{quote} I agree with you. Traditional indicators with good setting can make it best. When EMA7 (red) Stick together with BB17, 1 (Purple), Great Trend and don't leave. Let the profit runs. Otherwise, you will alert they don't kiss together is fault trend. {image}
Ignored
Thank you. The double BB and EMA mix is really interesting. Have you noticed that every period (quarter/year) the parameters change from BB17 to another BB-setting? Did you experience this also?
{quote} Thank you. The double BB and EMA mix is really interesting. Have you noticed that every period (quarter/year) the parameters change from BB17 to another BB-setting? Did you experience this also?
Ignored
It works in all timeframes, from tick chart to year chart.
Even on Bitcoin.
But NOT WORK anymore in HSI since October, 2016. after it release in someway in Hong Kong Forum.
{quote} As i wrote, for me it's one of my TOP indicators. Isn't it the purpose of this thread. If you only want to collect stuff, then you can surely ignore me. There enough others that will share stuff for all the beggars and collectors here.
Ignored
I agree, for those share on Free, most likely NOT work anymore, but good backtest in the past.
If anyone don't make good money control, whatever strategy he/she use, he/she will be kicked out from the market.
{quote} I agree, for those share on Free, most likely NOT work anymore, but good backtest in the past. If anyone don't make good money control, whatever strategy he/she use, he/she will be kicked out from the market.
Ignored
Most of the users here are only searching for free stuff to get �rich�. Most of them don�t even thank people who created and shared their stuff. No respect at all for their work. That makes me sick. Getting all without giving something back. That�s why I will not share anything here (if so only with expire data). If someone is interested then you get feedback when the expiration is come (or you get the beggars that whining). On positive feedback and with help of the interested ones you can hopefully make stuff better, but this is not the normal case.
Question to all readers. Whenever you test a new indicator, how do you test them exactly? For example, are you going back manually to 2018 January and check every condition until 25th June (today) whether the indicator matches the price or not?
Question to all readers. How do you test Moving Averages? Do you tryout all SMA and EMAs or only SMA (because it's easier)? Do you tryout the basic Moving Averages: 10, 20, 50, 100 and 200 MAs? Or also other ones like DMA21 and EMA13?
The answer to both of your questions would be to integrate them in an EA that "simulates taking trades" based on the behavior of the indicator. As long as it strolls down the path in the same way the bars do (i.e. from further past to less past) and takes only fully closed bars into account, this is a solid way to see what an indicator would have done, would you have used it during this period on these bars. For this some common sense and programming skills are required. I have a "construction" that does this, but as it is undocumented, it is useless for anyone else. Besides I would find it hard to guarantee that it works under all circumstances and for all indicators, regardless of how they operate. But it works, and is very useful.
And it is fairly easily started! e.g:
Trying out several parameter settings would result in more for() loops around this one, with the values tested (like in the example the parameter iPP, that can be varied at will).
Of course you could also write an EA that actually takes trades and put that one in a known tester. Through an EA is the only way I know of to test an indicator...
Question to all readers. How do you test Moving Averages?
Do you tryout all SMA and EMAs or only SMA (because it's easier)?
Do you tryout the basic Moving Averages: 10, 20, 50, 100 and 200 MAs?
Or also other ones like DMA21 and EMA13?
Ignored
Test everything as possible as you can.
Well, the reason is NOT for easy, but find out the less delay MA.
There is an indicator call All Average 2.XX few years ago.
This give 27 methods of MA, can quick lunch and test it one by one.
Question to all readers. How do you test Moving Averages? Do you tryout all SMA and EMAs or only SMA (because it's easier)? Do you tryout the basic Moving Averages: 10, 20, 50, 100 and 200 MAs? Or also other ones like DMA21 and EMA13?
Ignored
MA's a own universe in trading. You have so many ways you can combine and interprete them.
MA crosses, MA alignment (like guppy or rainbow), difference between them like in AO or AC. Combined with the different periods, calculations (SMA, EMA, DMA, Hull), undelying prices and you will end up in trillion different strategies.
Next Level is using MA's for other indicators like RSI and you end up with RSIOnMA
For me it's only fancy stuff to distract you. Why? Assume we had something like a holy grail. Would you clone the logic of that holy grail with lagging input? I guess not. But that's the truth. MA's always having lag implemented.
The only way you can use them and exploit other traders is to know what they mean to them and expect reactions of price at that levels, e.g. if a strong grou of traders react on SMA200 then keep that in mind and close your trade at that level or even reduce distance to SL etc.
Old version was out of date. Here is the updated version, I removed the dot-notation in the mq4 file (since MQ introduced OOP aspects) and now it's working again.
How to use:
- extreme high and extreme low BB width means continuation signal aka trend
- one of the BB strategies is when BB width is high (but not extremely high) then it would be considered a bounce (ranged) signal
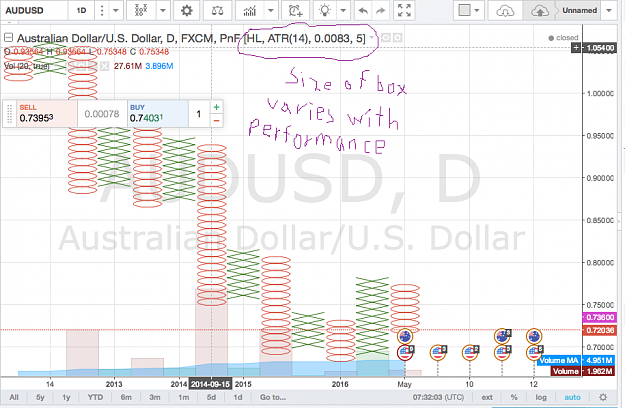
This pnf indicator I find very useful, because:
- it's clear
- good pattern recognition
- good breakout signals
- easy rules to follow
This indicator:
With well over a dozen P&F patterns, there is often an active pattern or pattern developing on a P&F chart. Identifying these patterns and the confirming breakout form an essential part of the P&F analysis process.
Bullish Breakout Patterns - Double Top Breakout, Triple Top Breakout, Spread Triple Top Breakout and Quadruple Top Breakout are covered in this group.
Bearish Breakdown Patterns - Double Bottom Breakdown, Triple Bottom Breakdown, Spread Triple Bottom Breakdown and Quadruple Bottom Breakdown are covered in this group.
Bullish and Bearish Catapults - Many P&F aficionados consider catapult signals the strongest. Catapults mark a classic breakout, a mild correction, and a continuation breakout.
Bullish and Bearish Triangles - These patterns resemble triangles in bar charts, but a basic P&F signal is required for confirmation.
Bull and Bear Traps - These patterns are just as they sound. A bear trap suckers the sellers before rallying, while a bull trap suckers the buyers before declining.
How does the indicator work:
PnF Charts
This indicator displays Point & Figure charts (PnF charts) in the indicator window. PnF charts show only price movements that are bigger than the specified box size. It helps to eliminate noise and allows focusing on main trends.
Time is not a factor here. Only price movements are taken into account. That is why PnF chart is not synchronized with the main chart it is attached to.
More about PnF charts: http://stockcharts.com/school/doku.php?id=chart_school:chart_analysis:stuck_out_tongue_winking_eye:nf_charts
Indicator works in two modes:
CLOSE - only close prices are taken into account while building the chart
HIGH_LOW - only high/low prices are taken into account
The chart is updated only after closing of each bar. It means that PnF chart will be updated more frequently when attached to M1 and less frequently when attached to charts of higher timeframes.
Features:
Reversal amount can be changed
Two methods of drawing 1-box reversal charts (compressed and normal)
You can add up to 2 moving averages to the chart (SMA or EMA)
You can add Bollinger Bands to the chart
Colors are fully customizable
Grid can be turned on and off
Moving and zooming the chart with keyboard
Bollinger Bands and Moving Averages can not be used in compressed 1-box reversal mode.
Parameters:
Price_Mode [CLOSE / HIGH_LOW] - in CLOSE mode the chart is built based on Close price of each bar while in HIGH_LOW mode the chart is built based on High and Low prices of each bar
Box_Size - minimal price movement required to draw a new box in the direction of current trend
Reversal_Boxes - minimal counter-trend price movement required to change the trend (entered as a number of boxes, default = 3)
Compress_1_Box_Chart - enables compressed mode of drawing 1-box reversal charts
Max Columns - sets the maximal number of columns to display
Scale - initial size of X's and O's
Draw_in_Main_Window - sets the location of the PnF chart (either main chart window or indicator's subwindow)
Draw_Grid - shows/hides the grid
Draw_Price_Scale - shows/hides the price scale on right side of the chart
Right_Shift - amount of empty space on the right side of the chart
Show_Info - shows/hides information label in the upper left corner
Draw_MA1 - adds a moving average to the chart (SMA or EMA)
MA1_Type, MA1_Color, MA1_Period, MA1_Shift - parameters of the first moving average
Draw_MA2 - adds a second moving average to the chart
MA2_Type, MA2_Color, MA2_Period, MA2_Shift - parameters of the second moving average
Draw_BB - adds Bollinger Bands to the chart
BB_Color, BB_Period, BB_Deviations, BB_Shift - parameters of Bollinger Bands
{quote} It works in all timeframes, from tick chart to year chart. Even on Bitcoin. But NOT WORK anymore in HSI since October, 2016. after it release in someway in Hong Kong Forum. Here is an example on Gold in quarter. Well, I have told you in last thread. This is your assignment if you want to do it. https://www.forexfactory.com/showthr...7#post11105367 {image}
Ignored
Hi, do you have any more references to this BB & ema method? e.g. links to the Hong Kong forum?
http://stockcharts.com/school/doku.p...e:nf_catapults This pnf indicator I find very useful, because: - it's clear - good pattern recognition - good breakout signals - easy rules to follow This indicator: With well over a dozen P&F patterns, there is often an active pattern or pattern developing on a P&F chart. Identifying these patterns and the confirming breakout form an essential part of the P&F analysis process. Bullish...